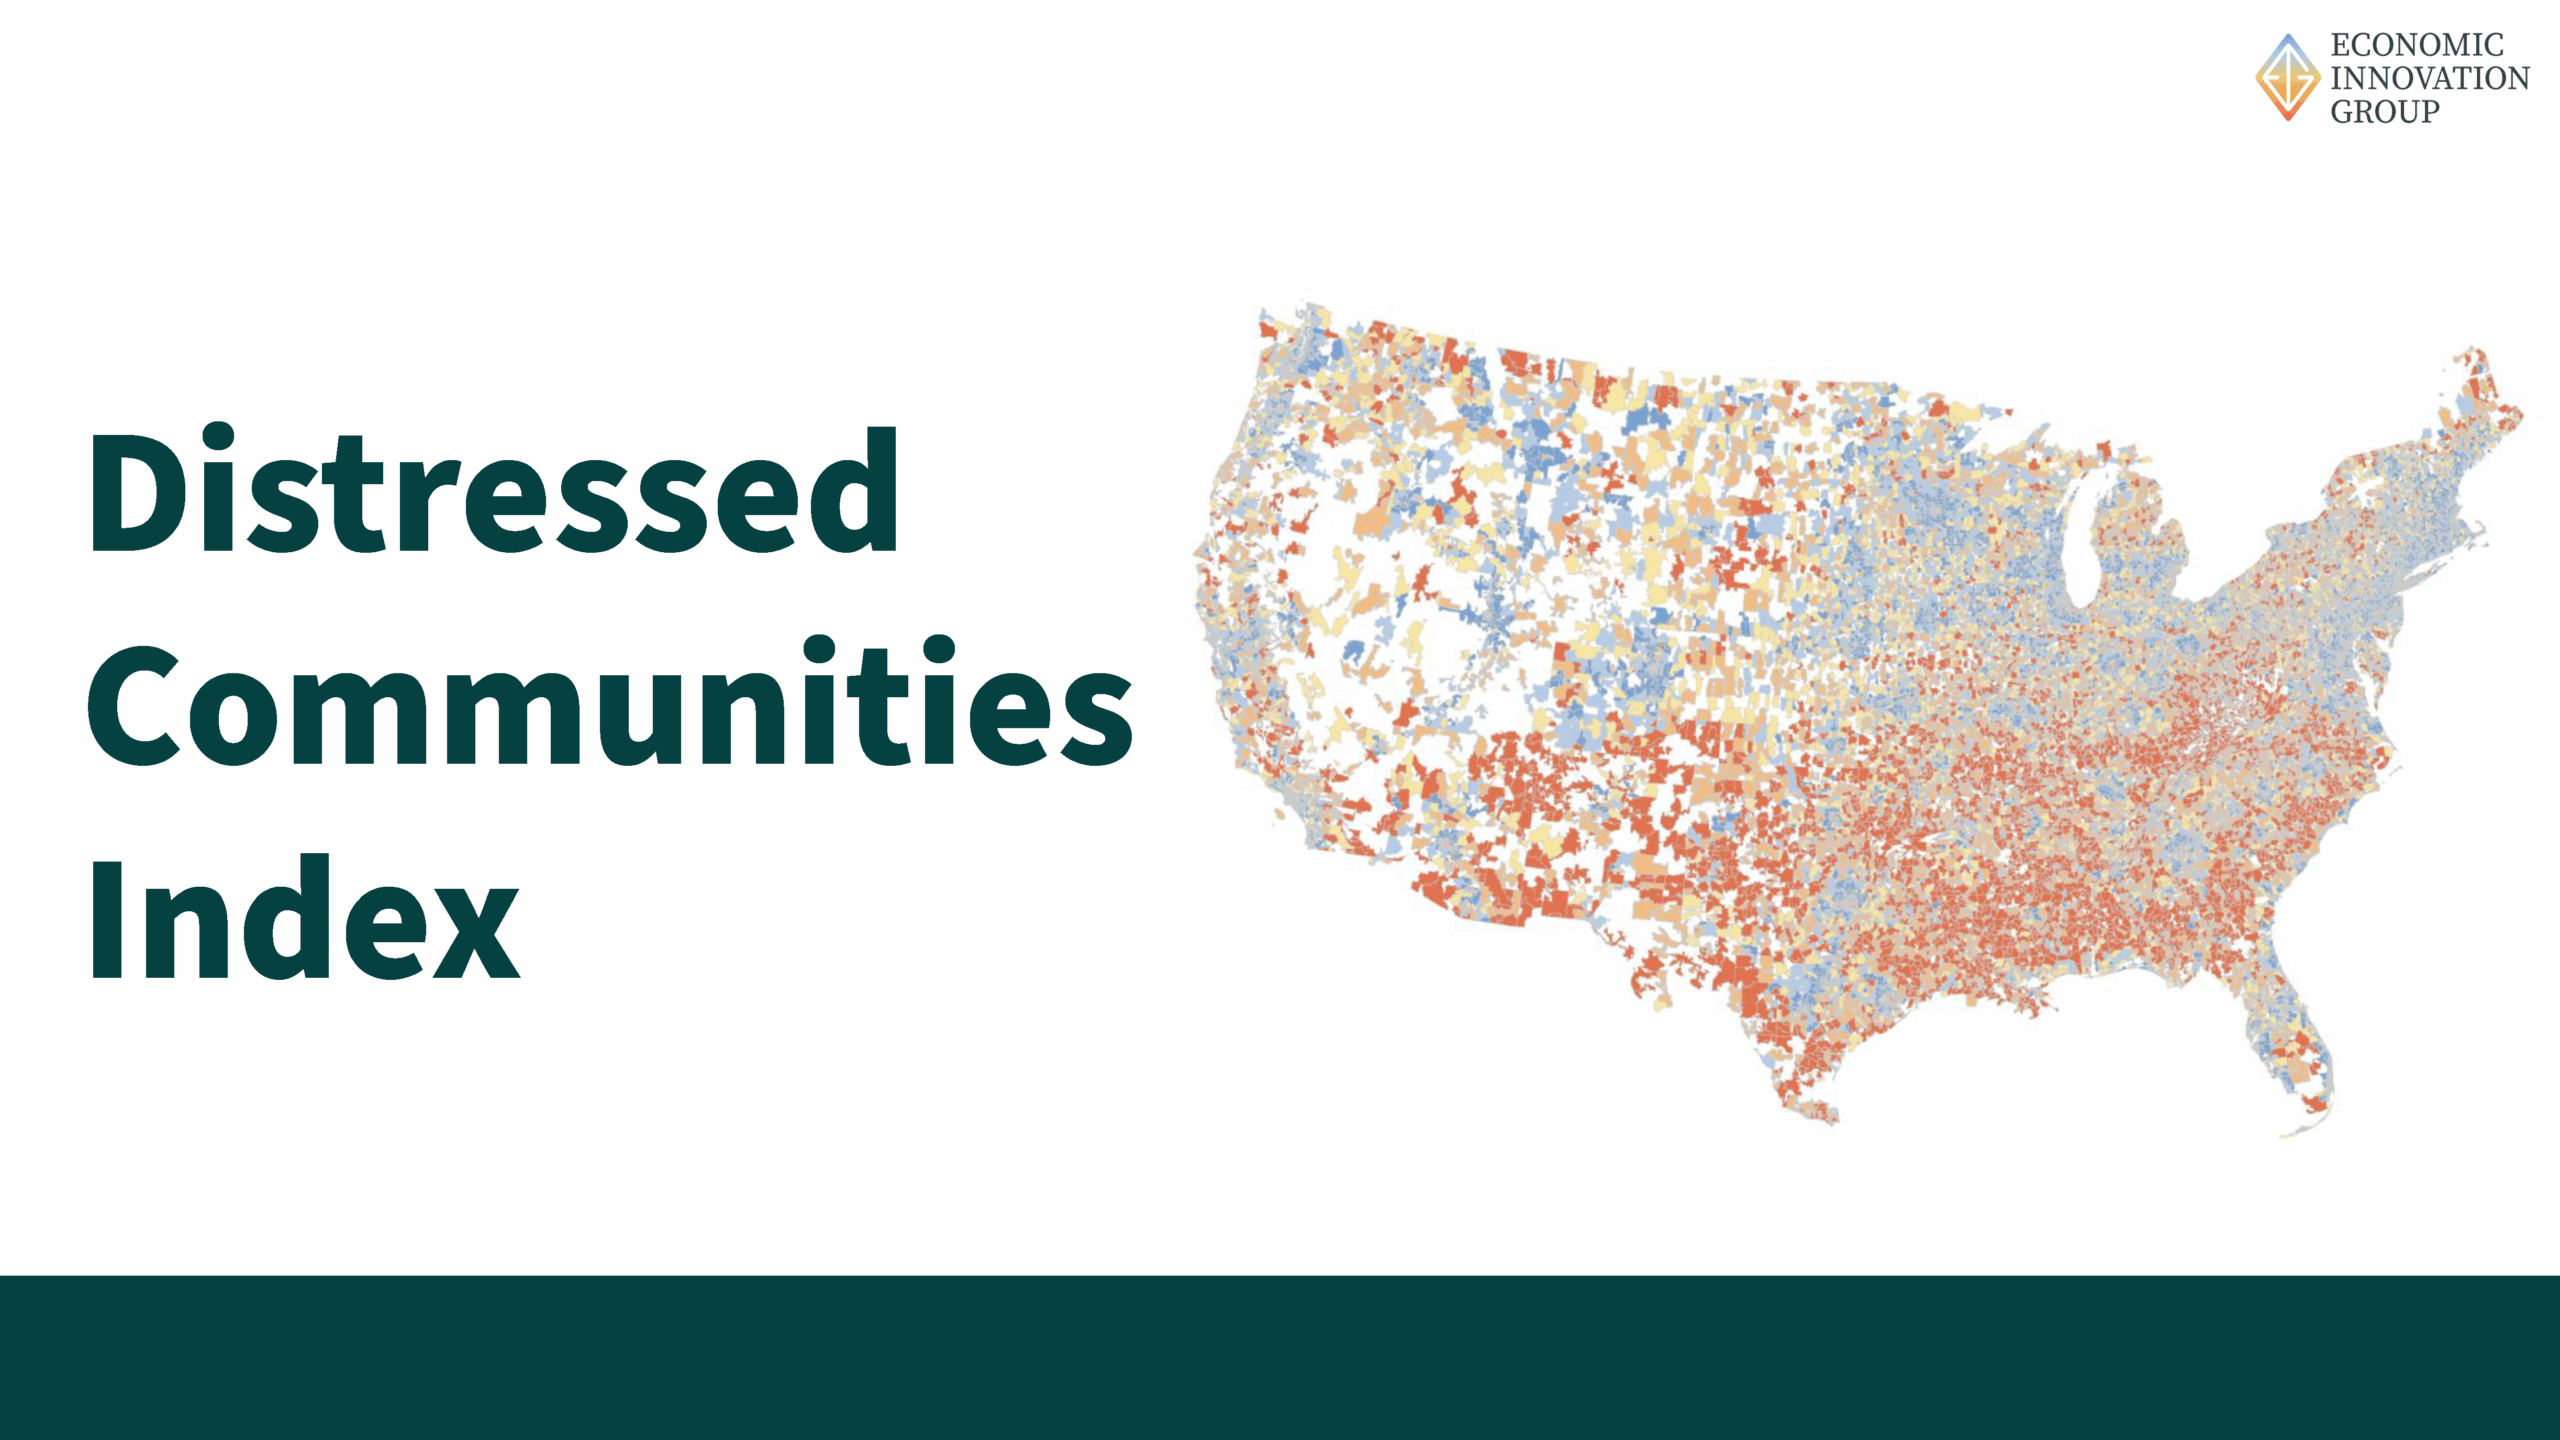
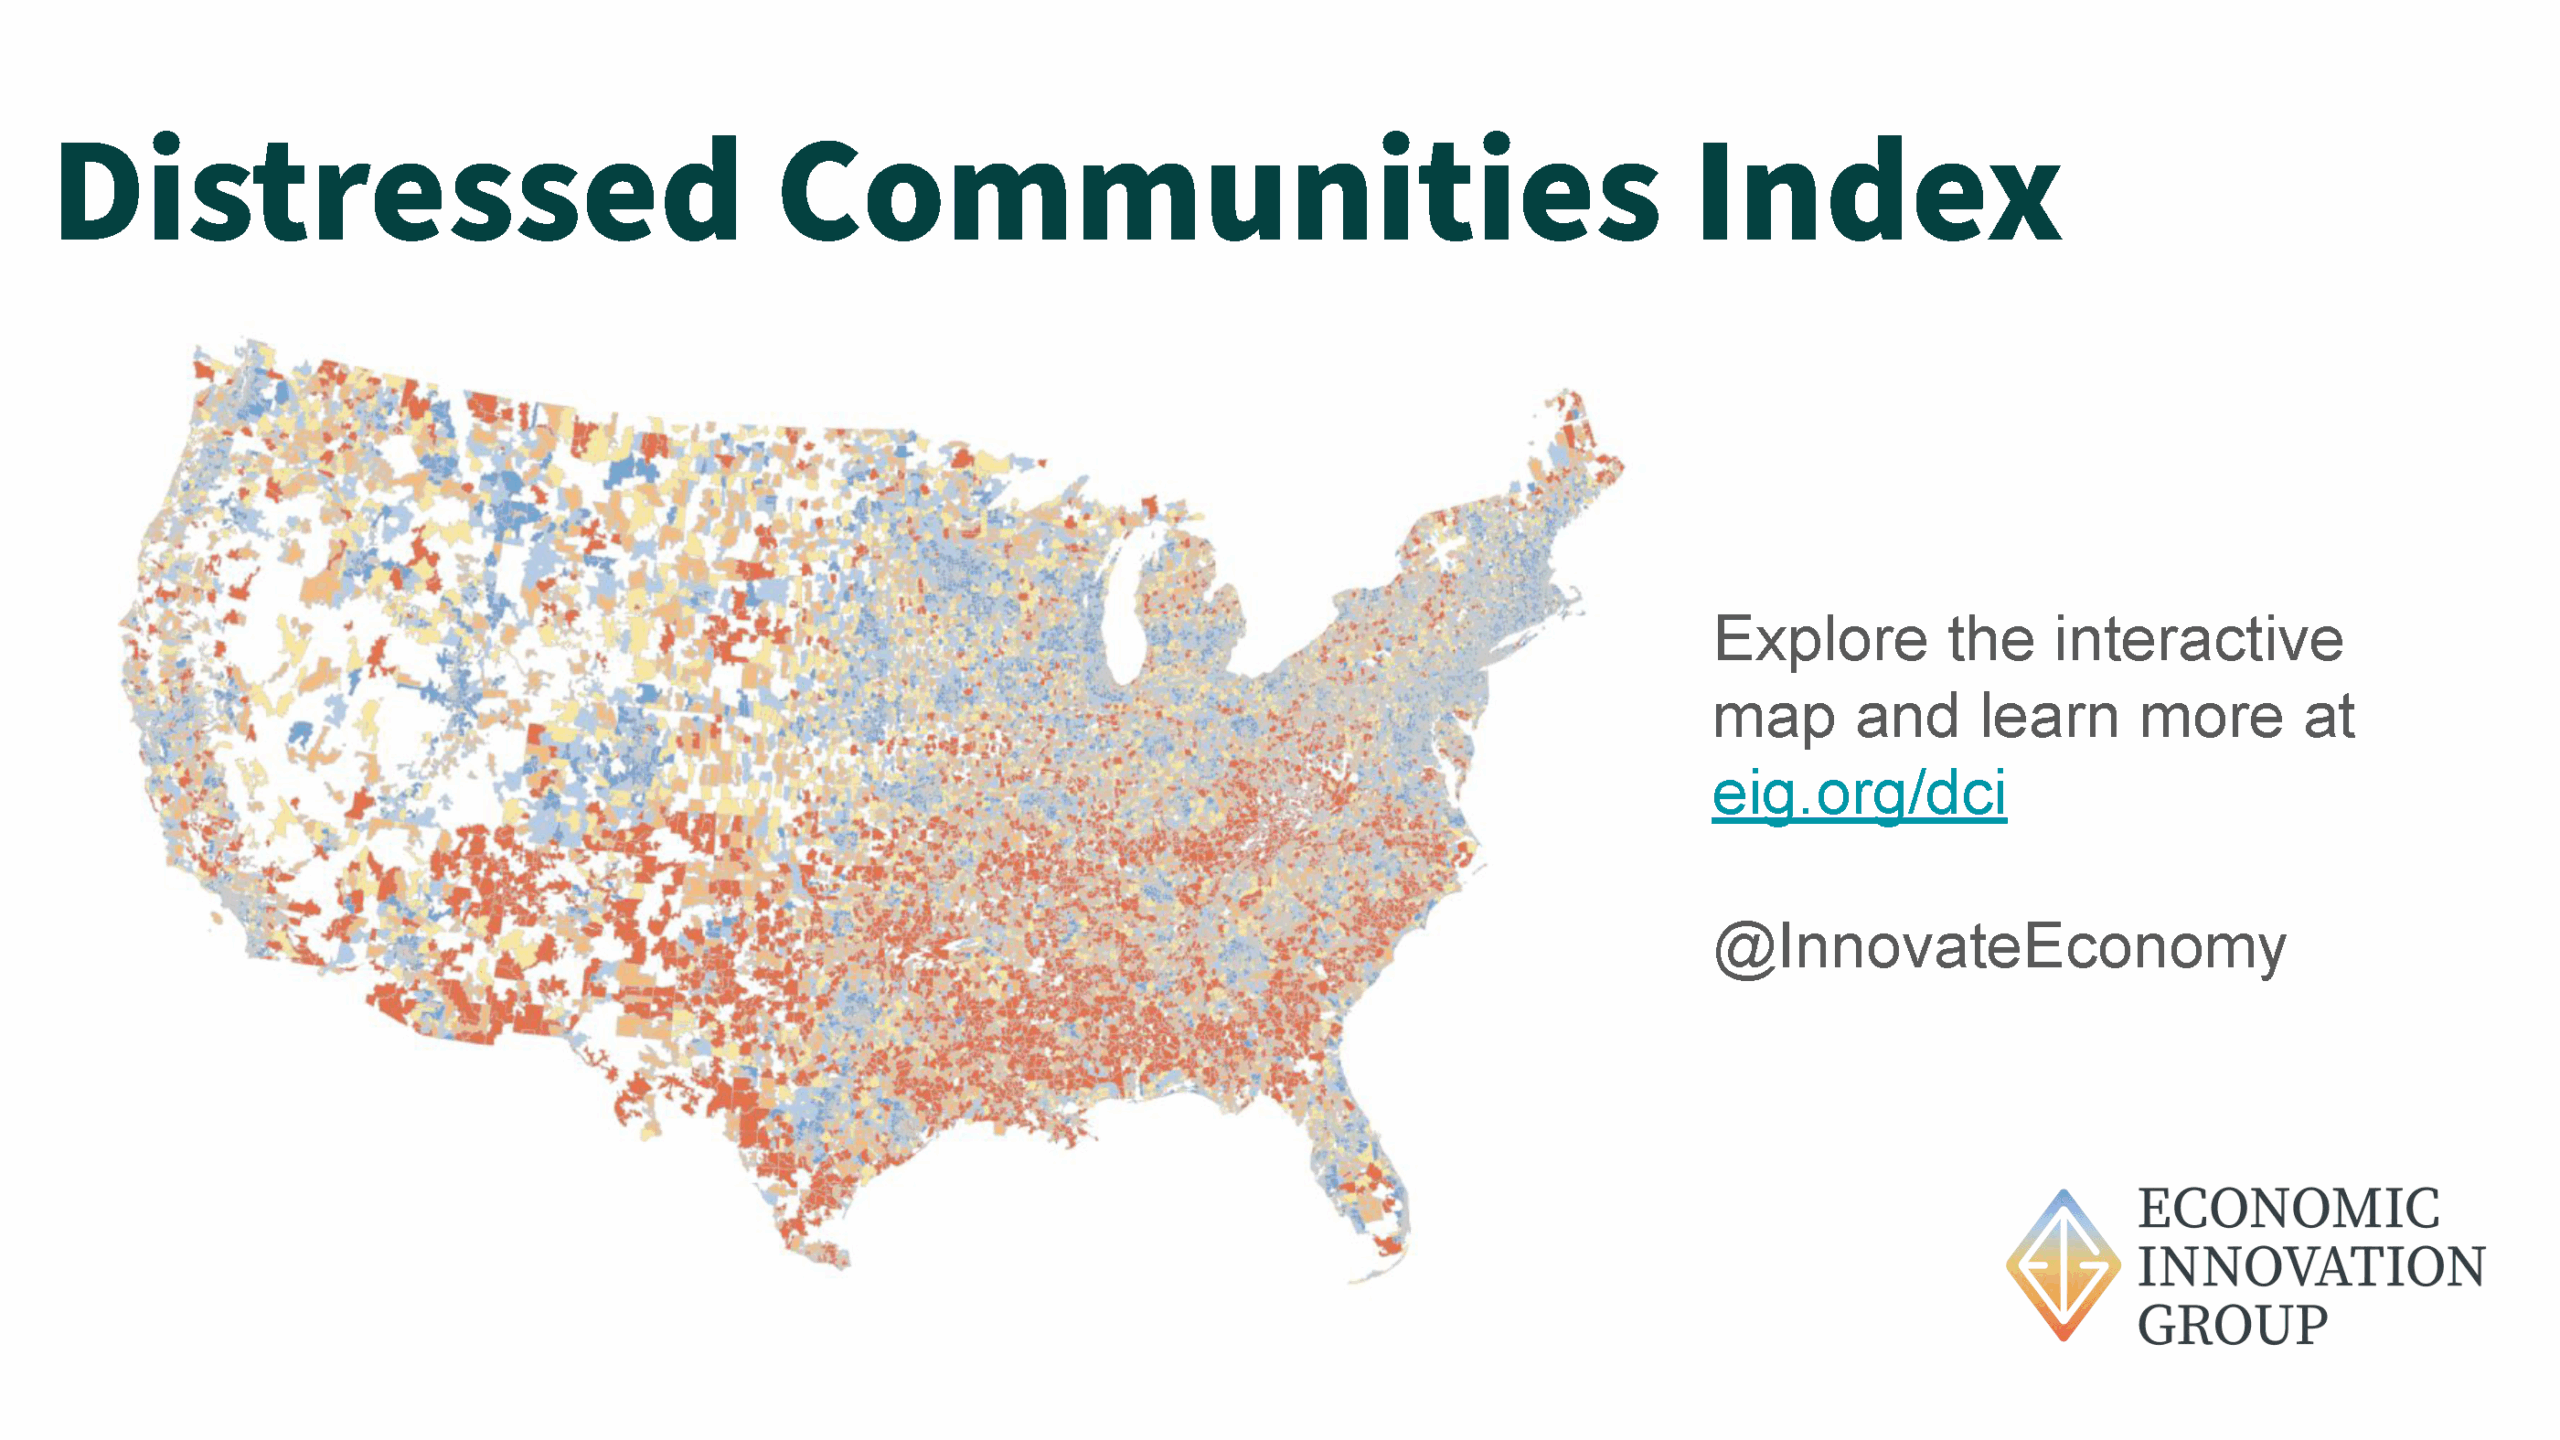
Distressed Communities Index (DCI)
A Definitive Lens on American Economic Well-Being
The Distressed Communities Index (DCI) is a leading resource for understanding the geography of economic distress and opportunity in the United States. First launched by the Economic Innovation Group in 2015 and updated annually, this groundbreaking dataset offers a comprehensive view of local economic health across the country — empowering the work of researchers, policymakers, investors, and community leaders alike.
The DCI has earned wide recognition and trust, cited by The New York Times, The Wall Street Journal, The Washington Post, and hundreds of national and local media outlets. It has been used in influential academic research across disciplines, from economics and political science to public health and urban planning. Its insights have shaped legislation, guided philanthropic initiatives, and informed private sector business strategies.


Why the DCI Matters

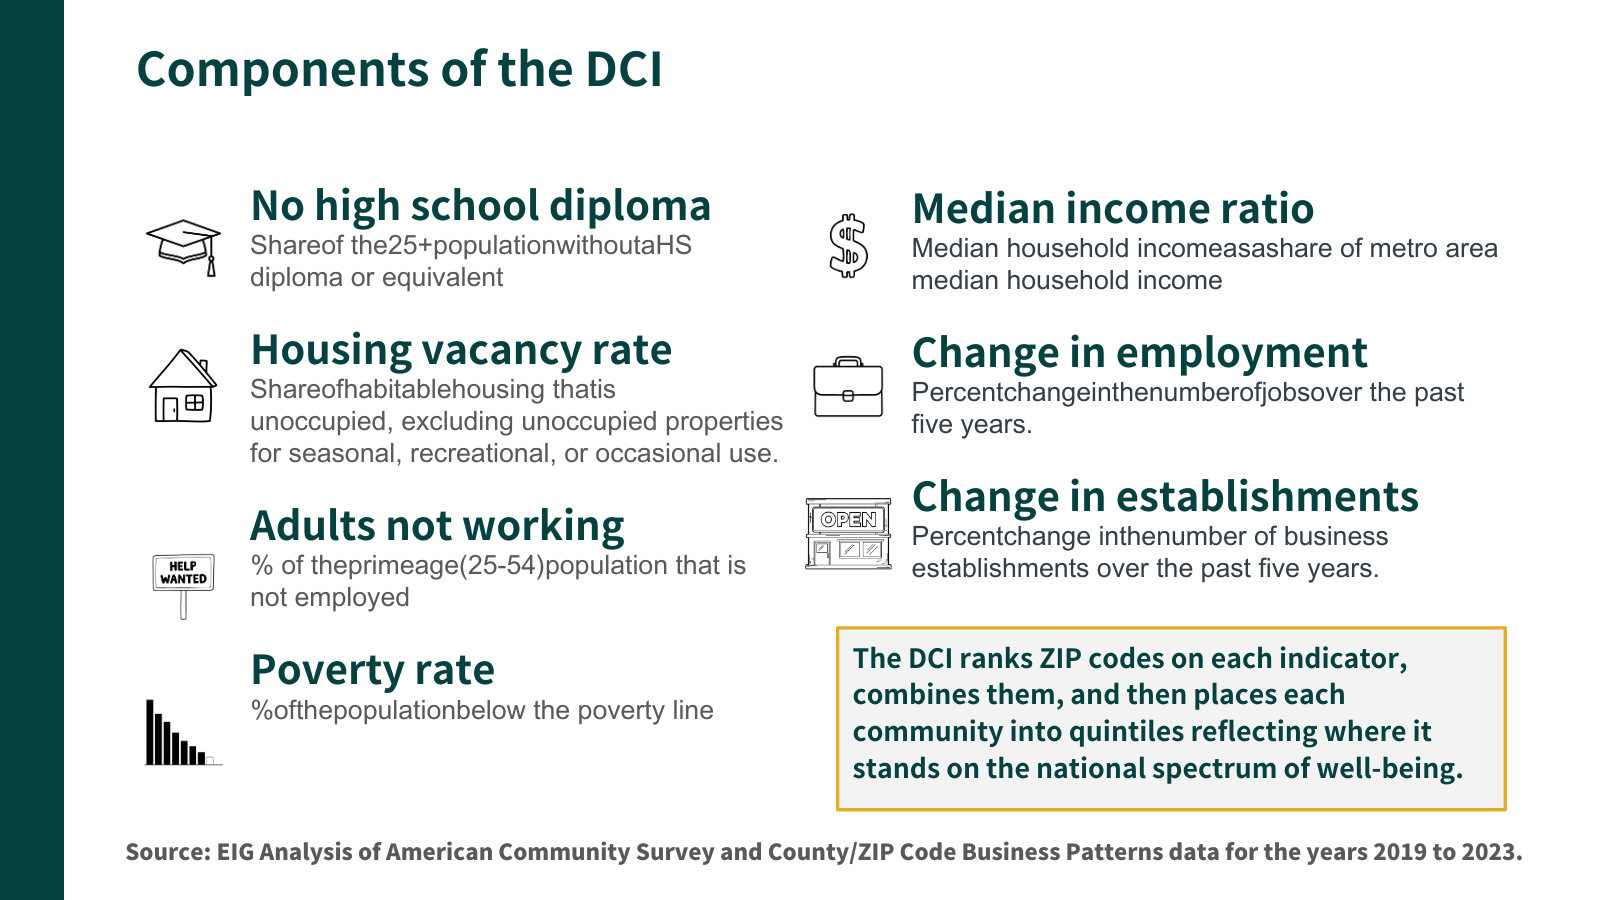
The Seven Indicators
Each community’s distress score is based on the following seven indicators:
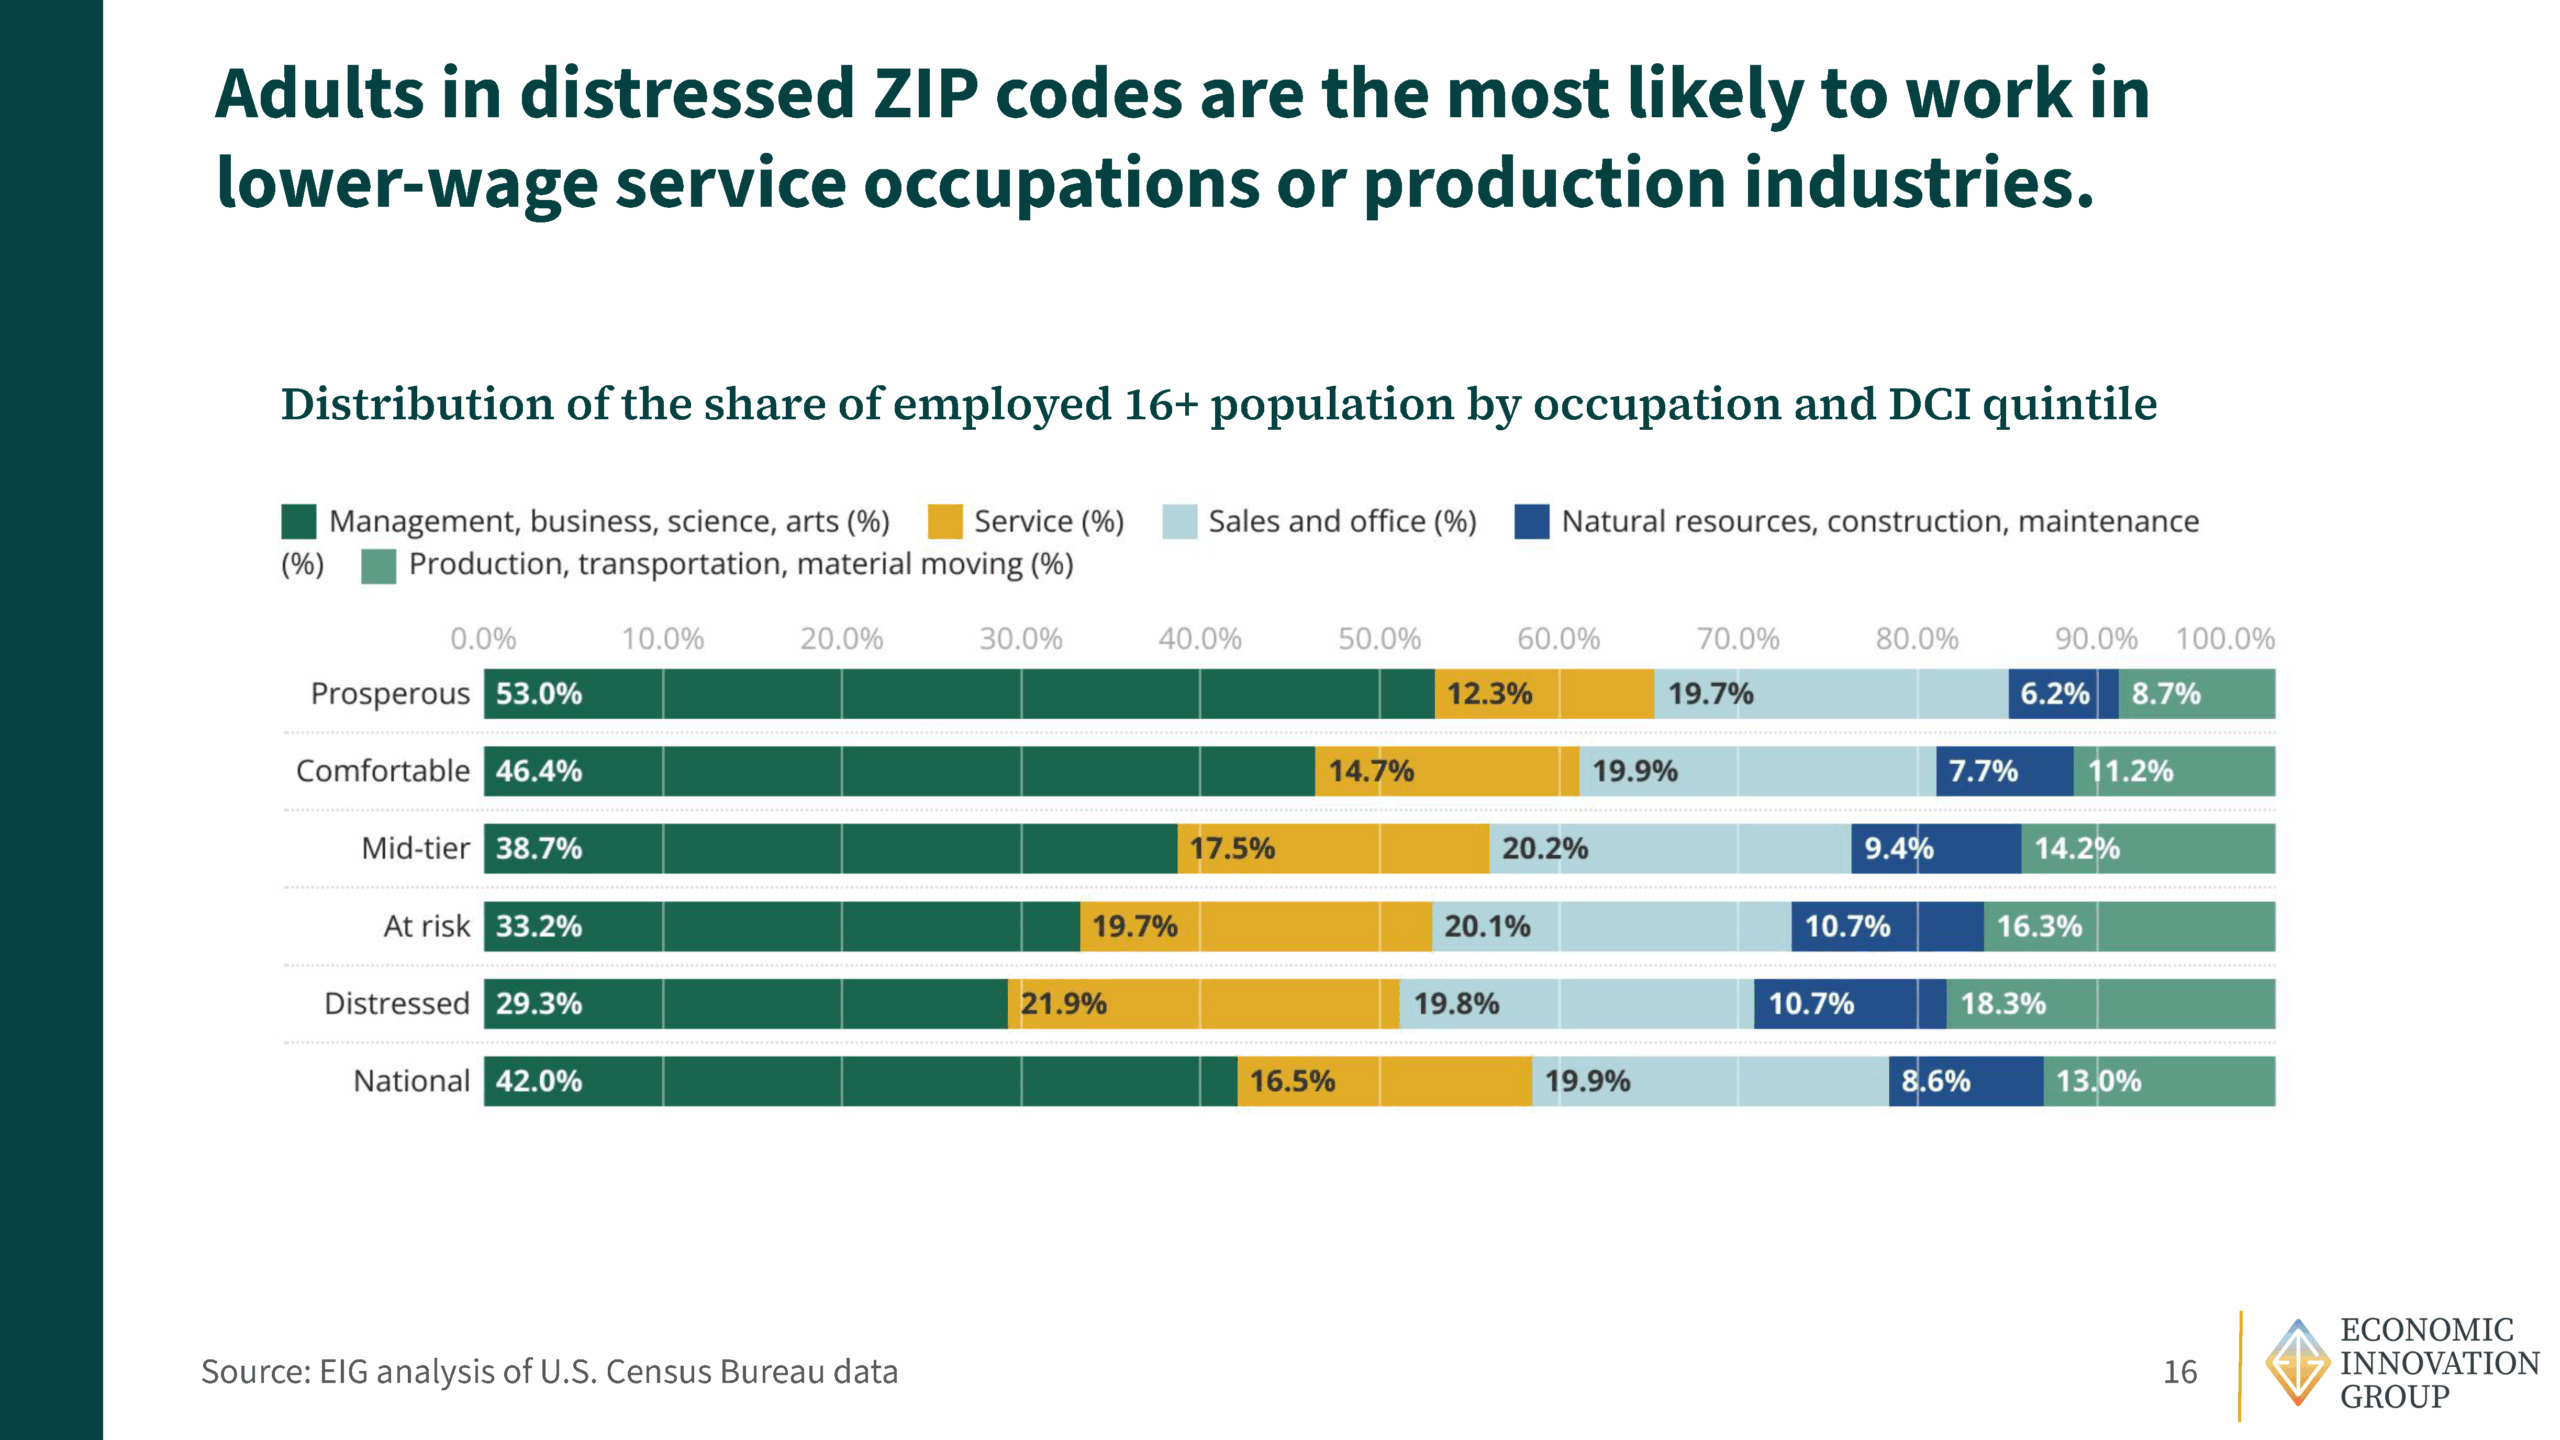
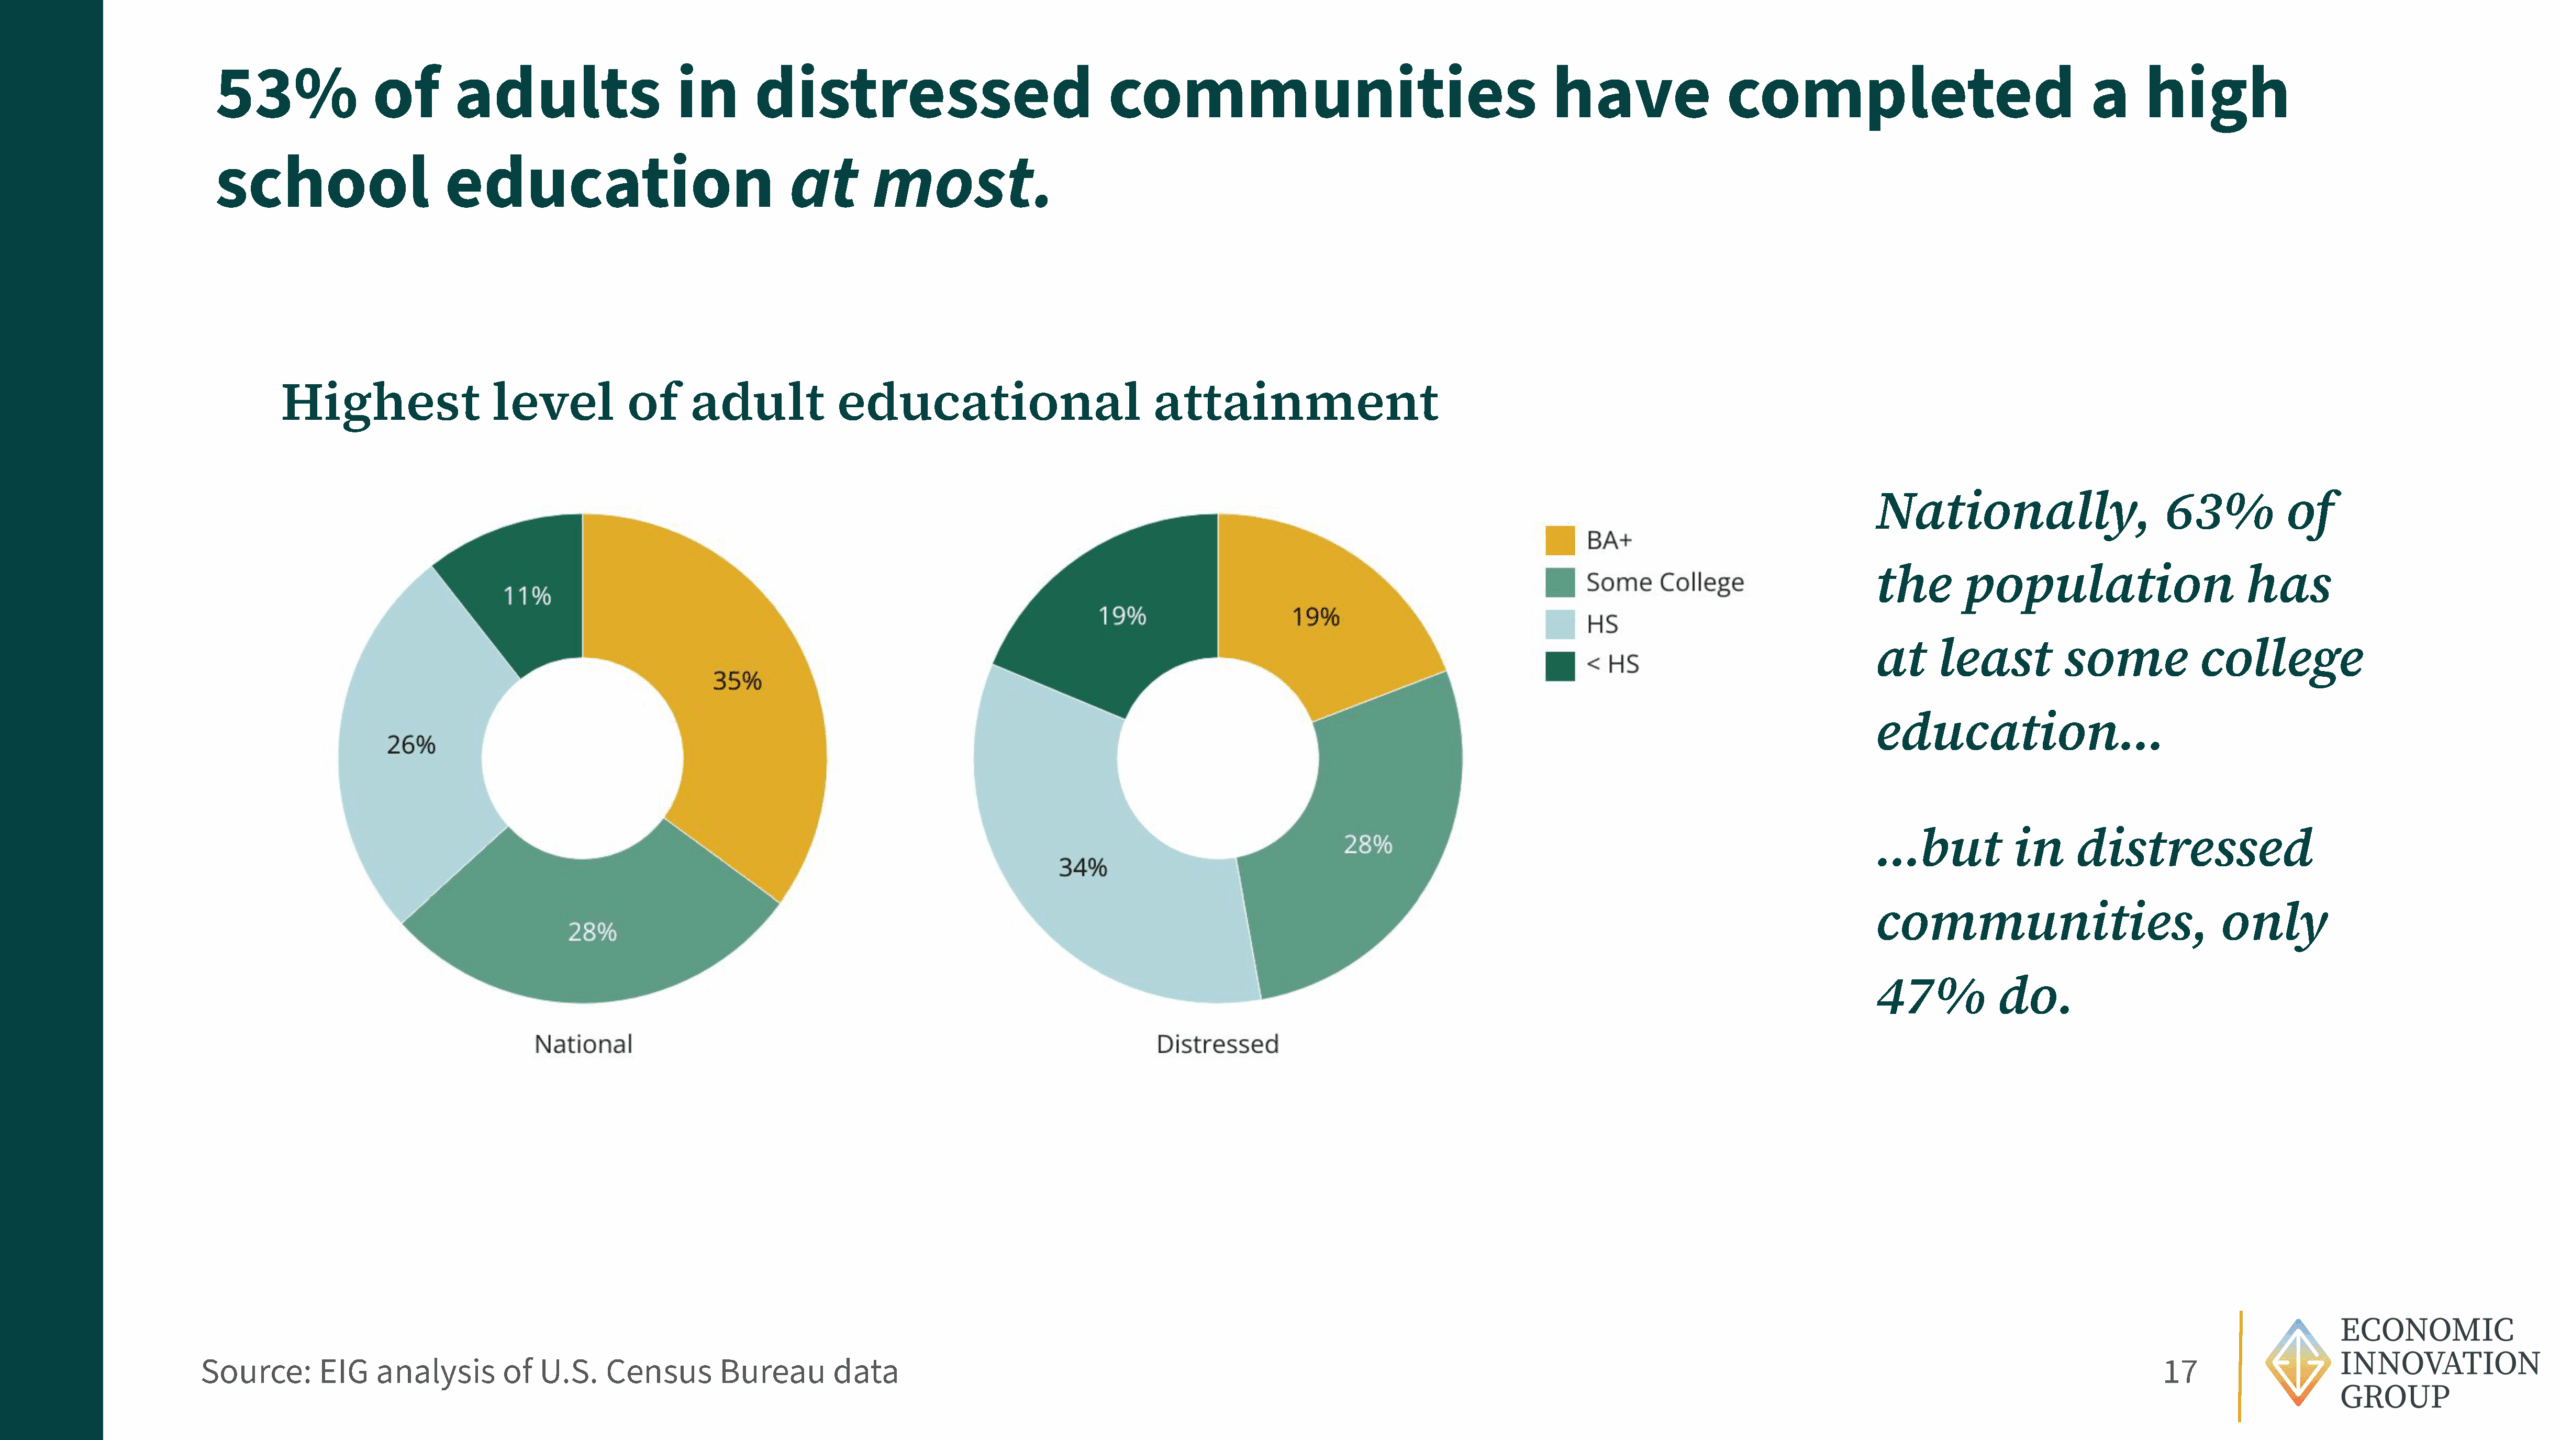
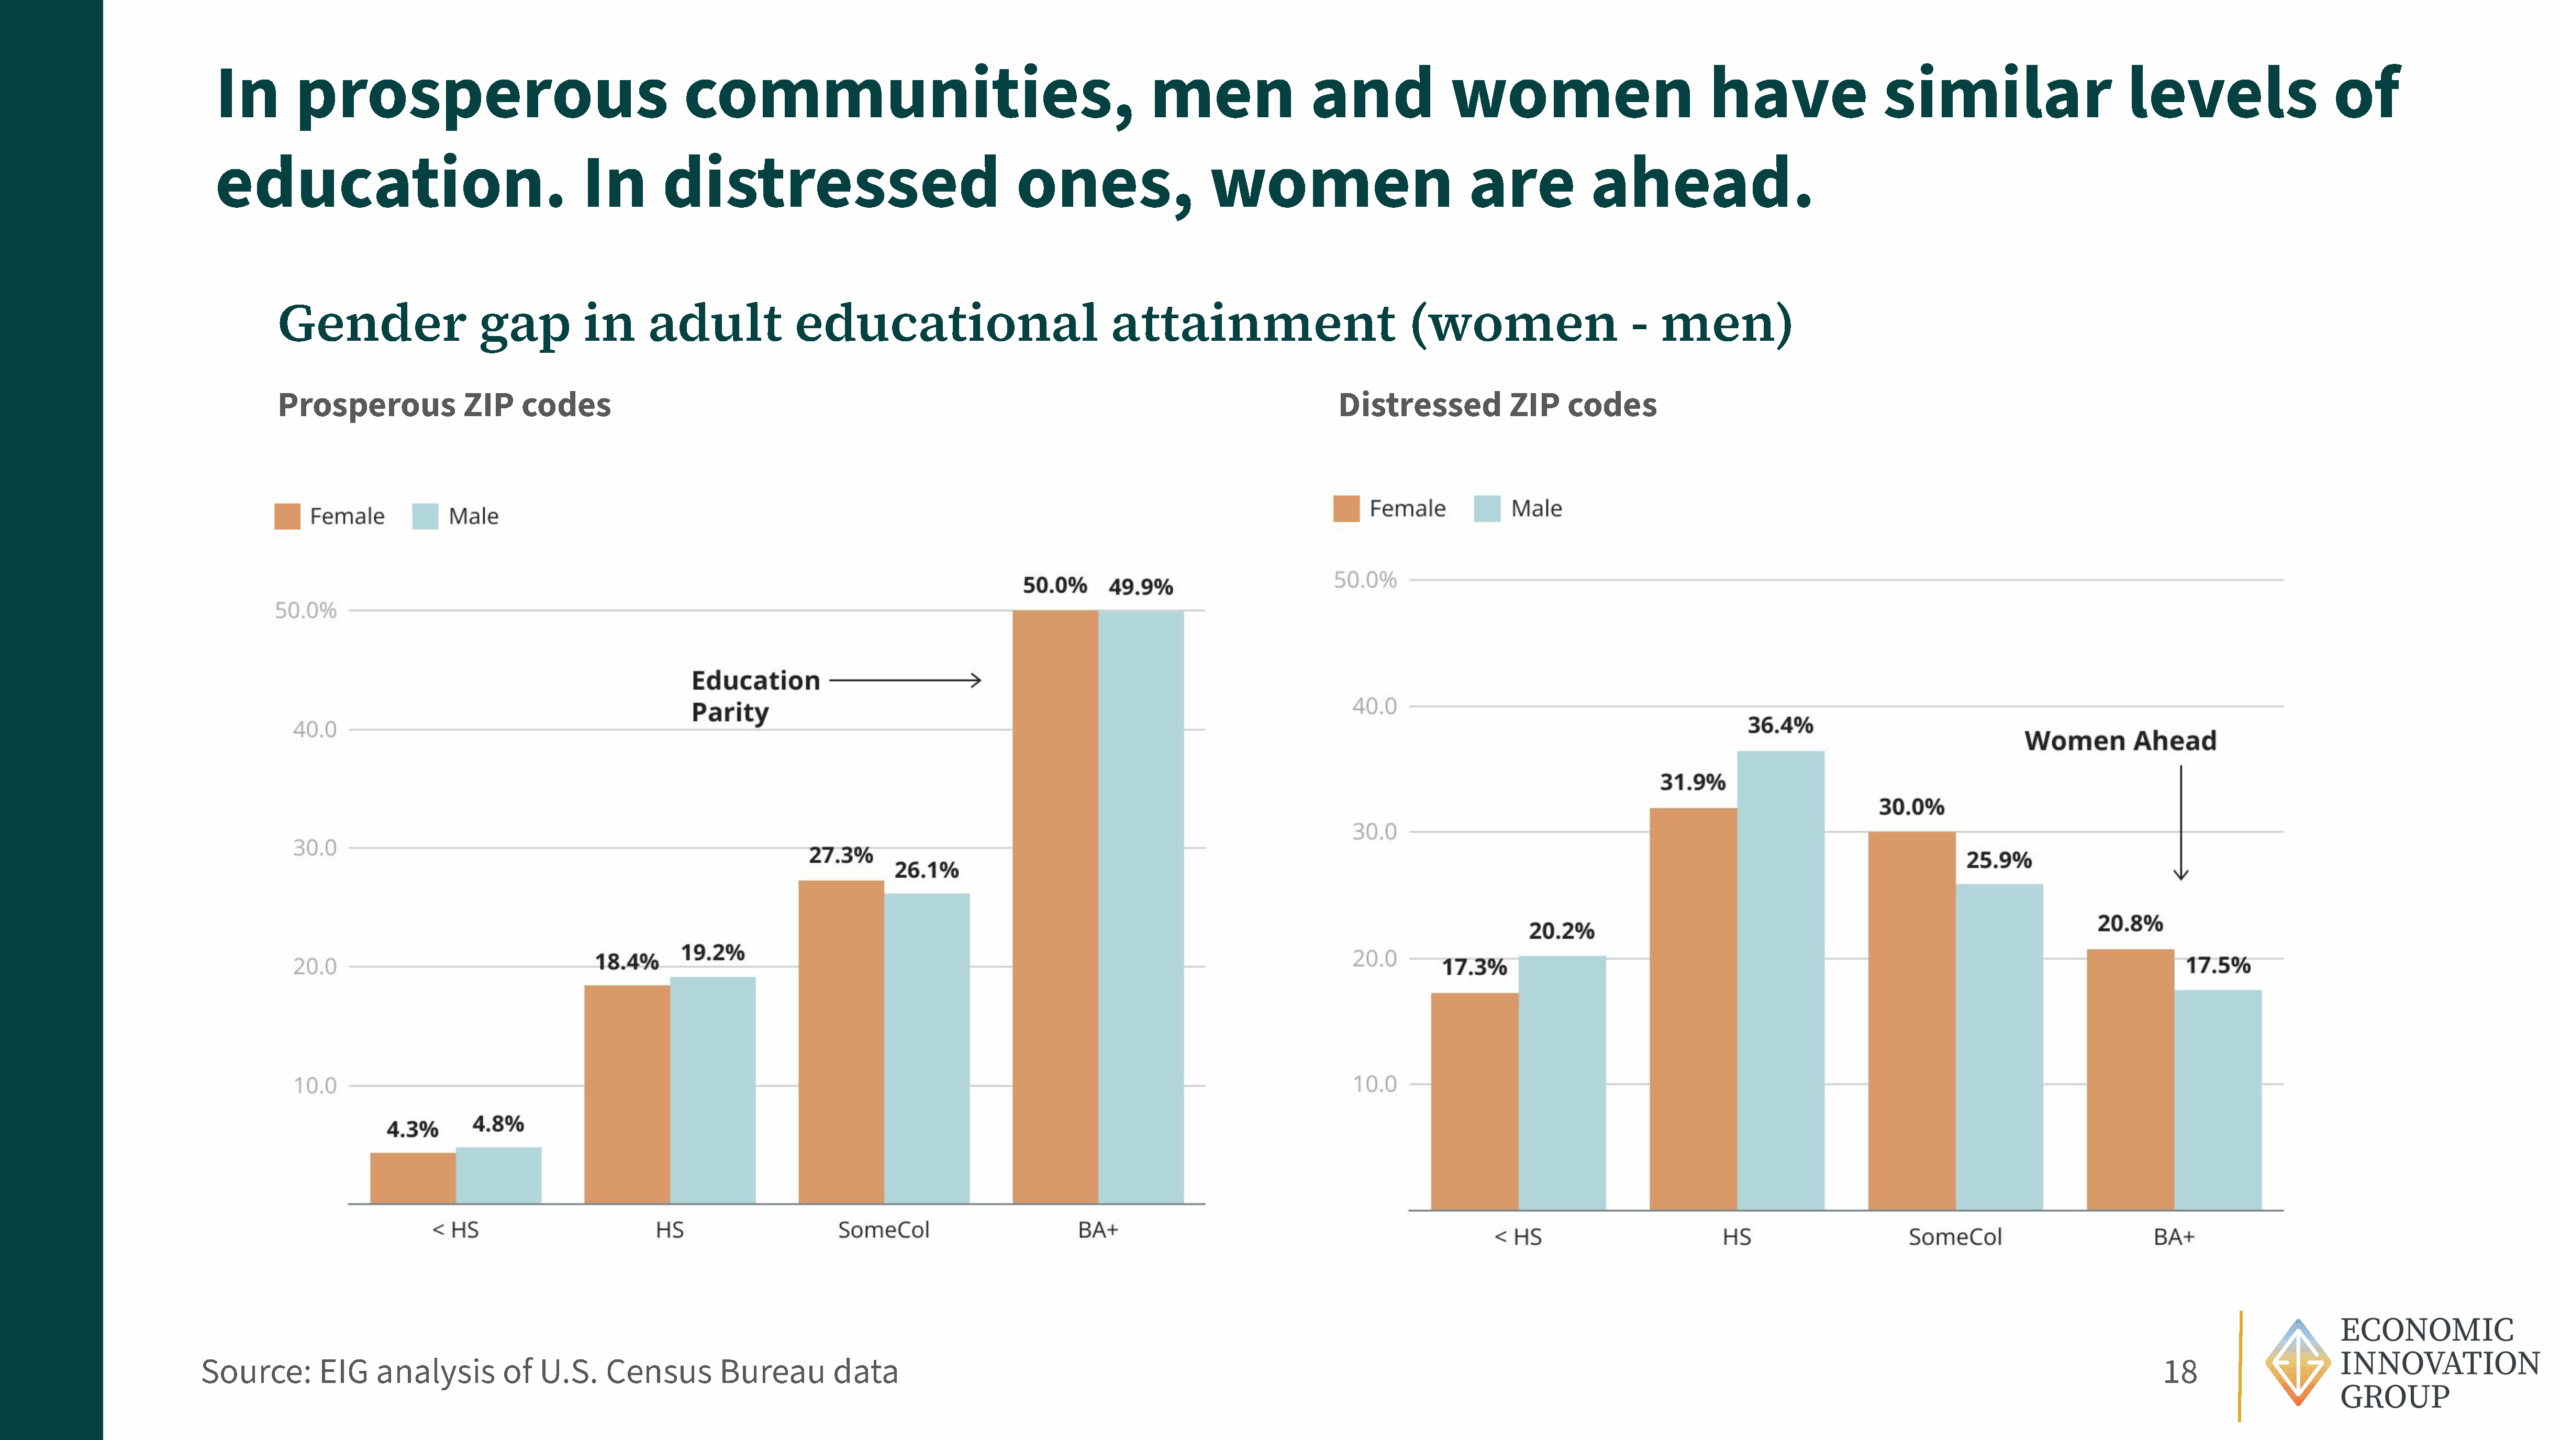
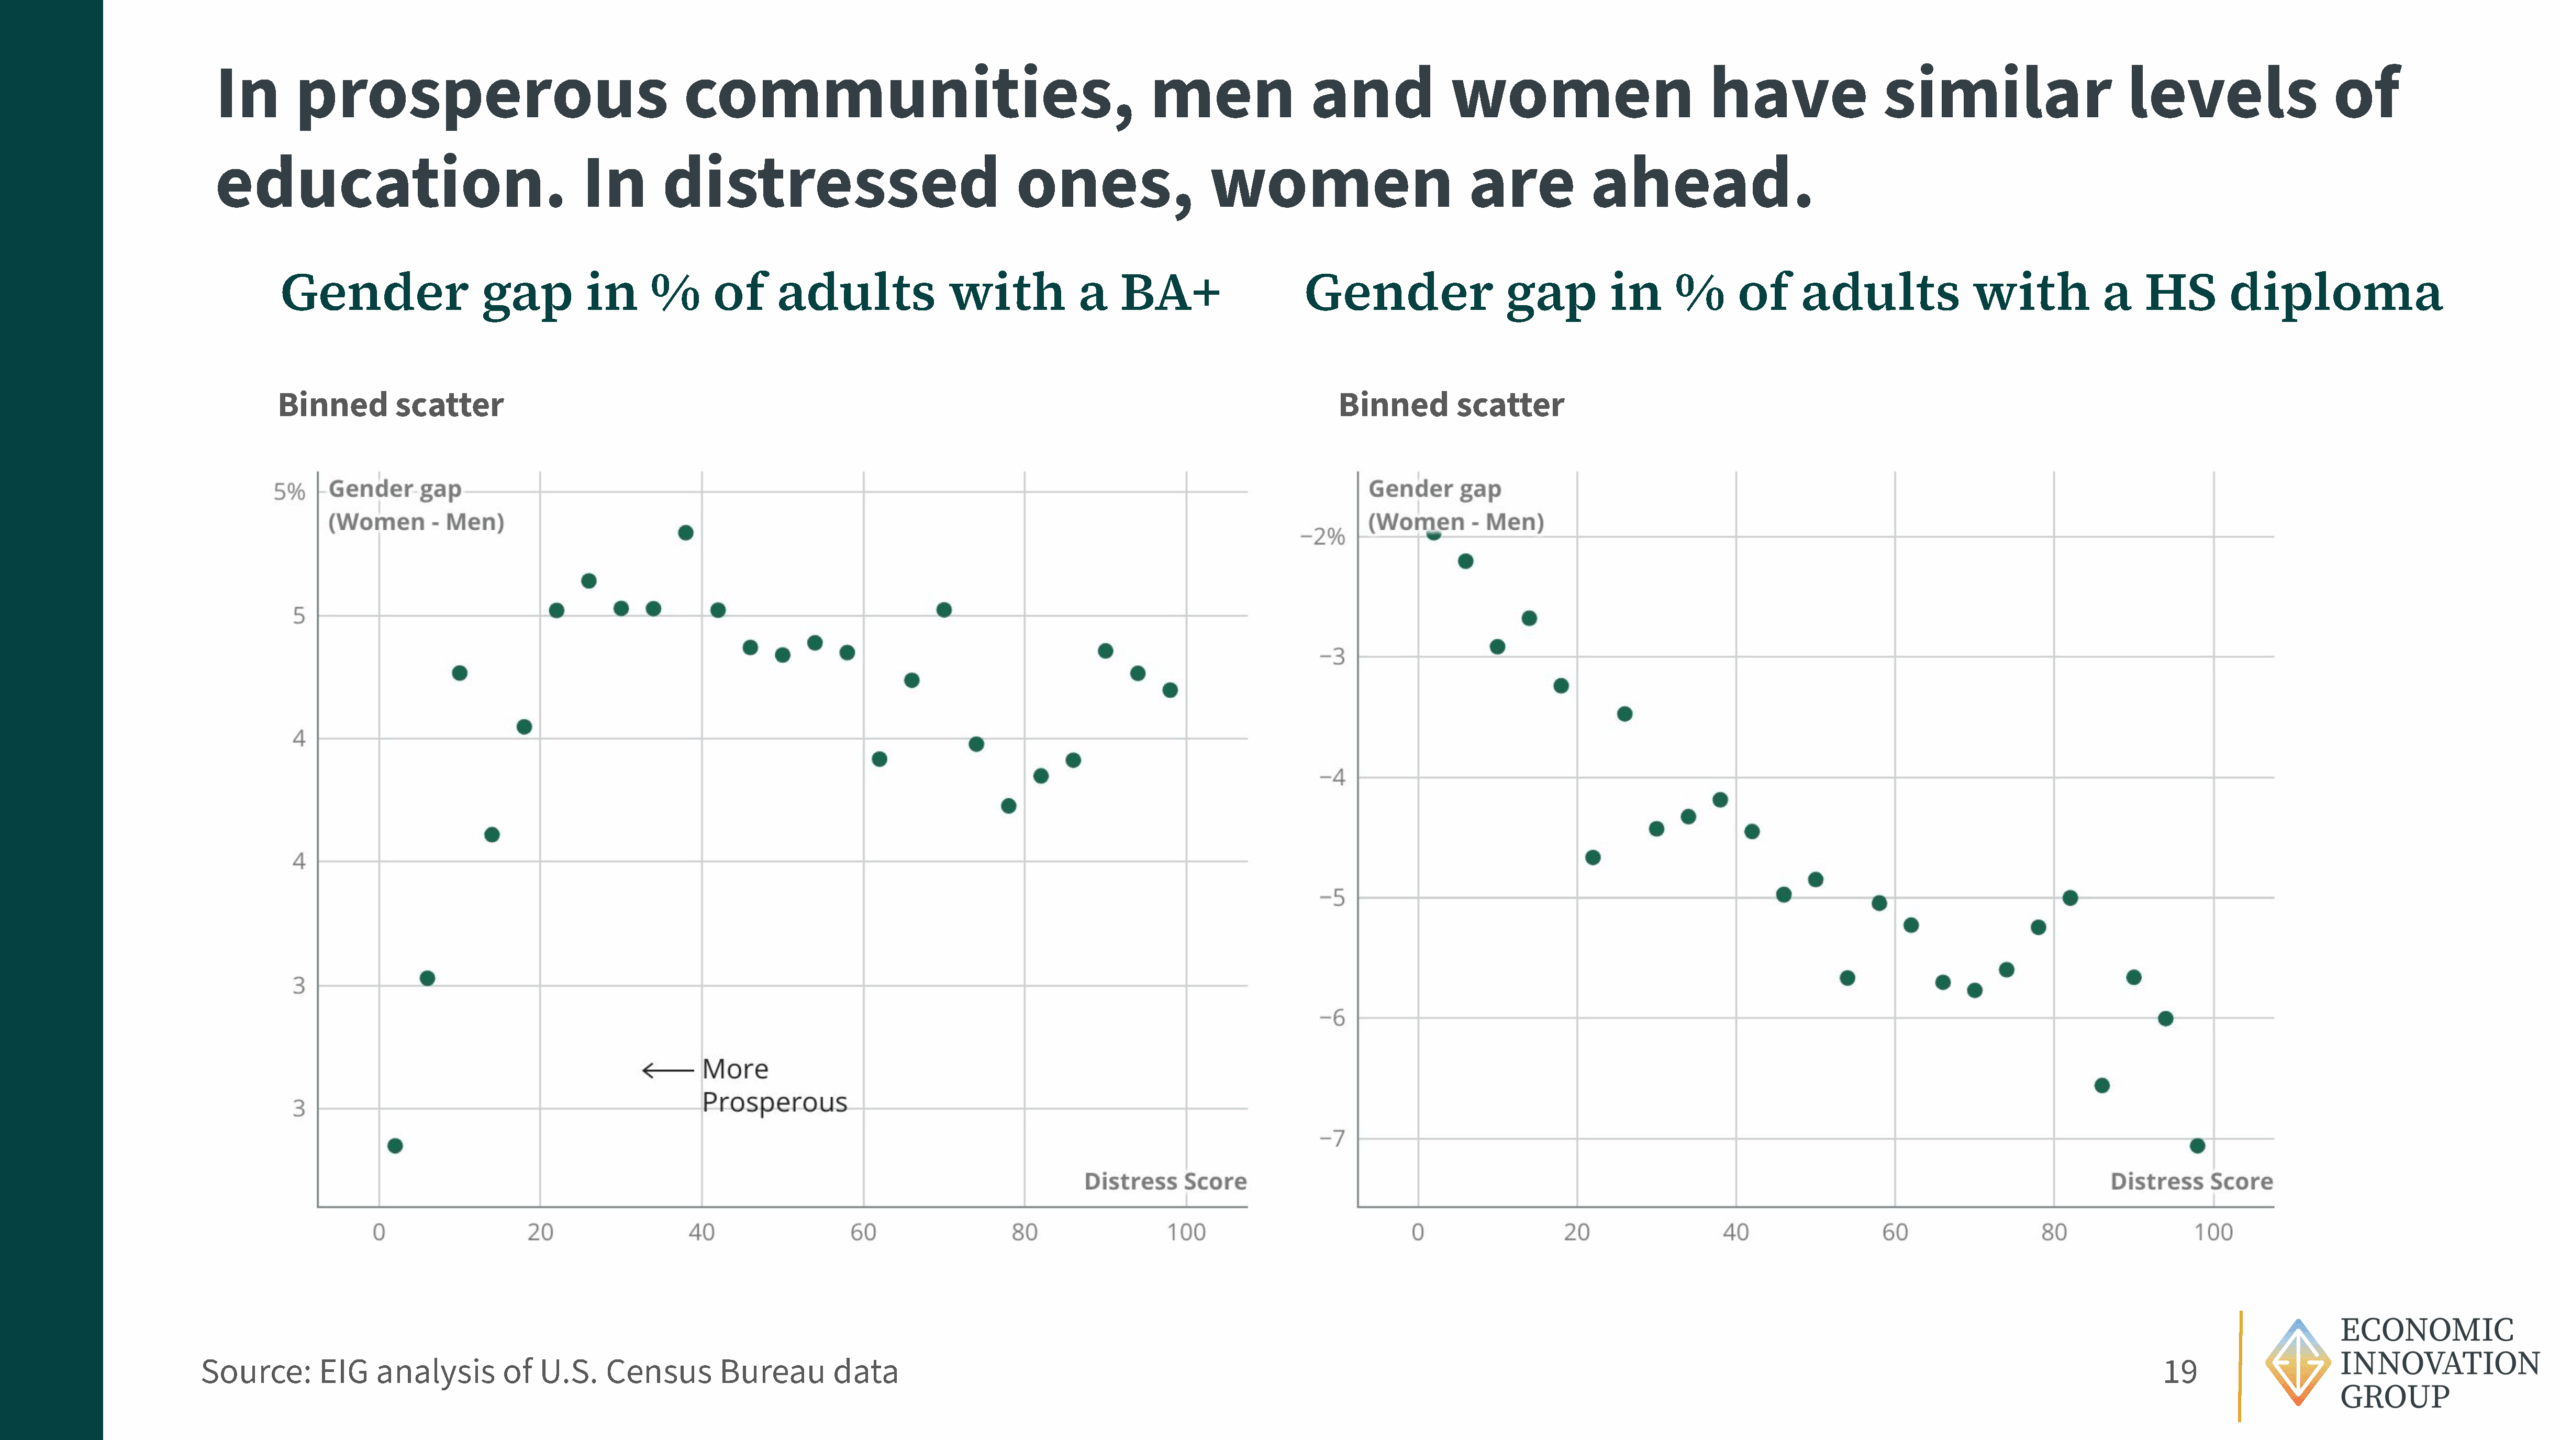
- No High School Diploma
Share of adults (25+) without a high school diploma or equivalent.
Signals limited educational attainment and constrained economic opportunity. - Housing Vacancy Rate
Share of habitable housing that is unoccupied (excluding seasonal/recreational use).
Acts as a proxy for neighborhood demand and infrastructure stability. - Adults Not Working
Share of prime-age adults (25–54) not currently employed.
Captures both unemployment and labor force detachment. - Poverty Rate
Share of the population living below the federal poverty line.
Directly measures material deprivation.
- Median Income Ratio
Local median household income as a percentage of the area median (metro or state).
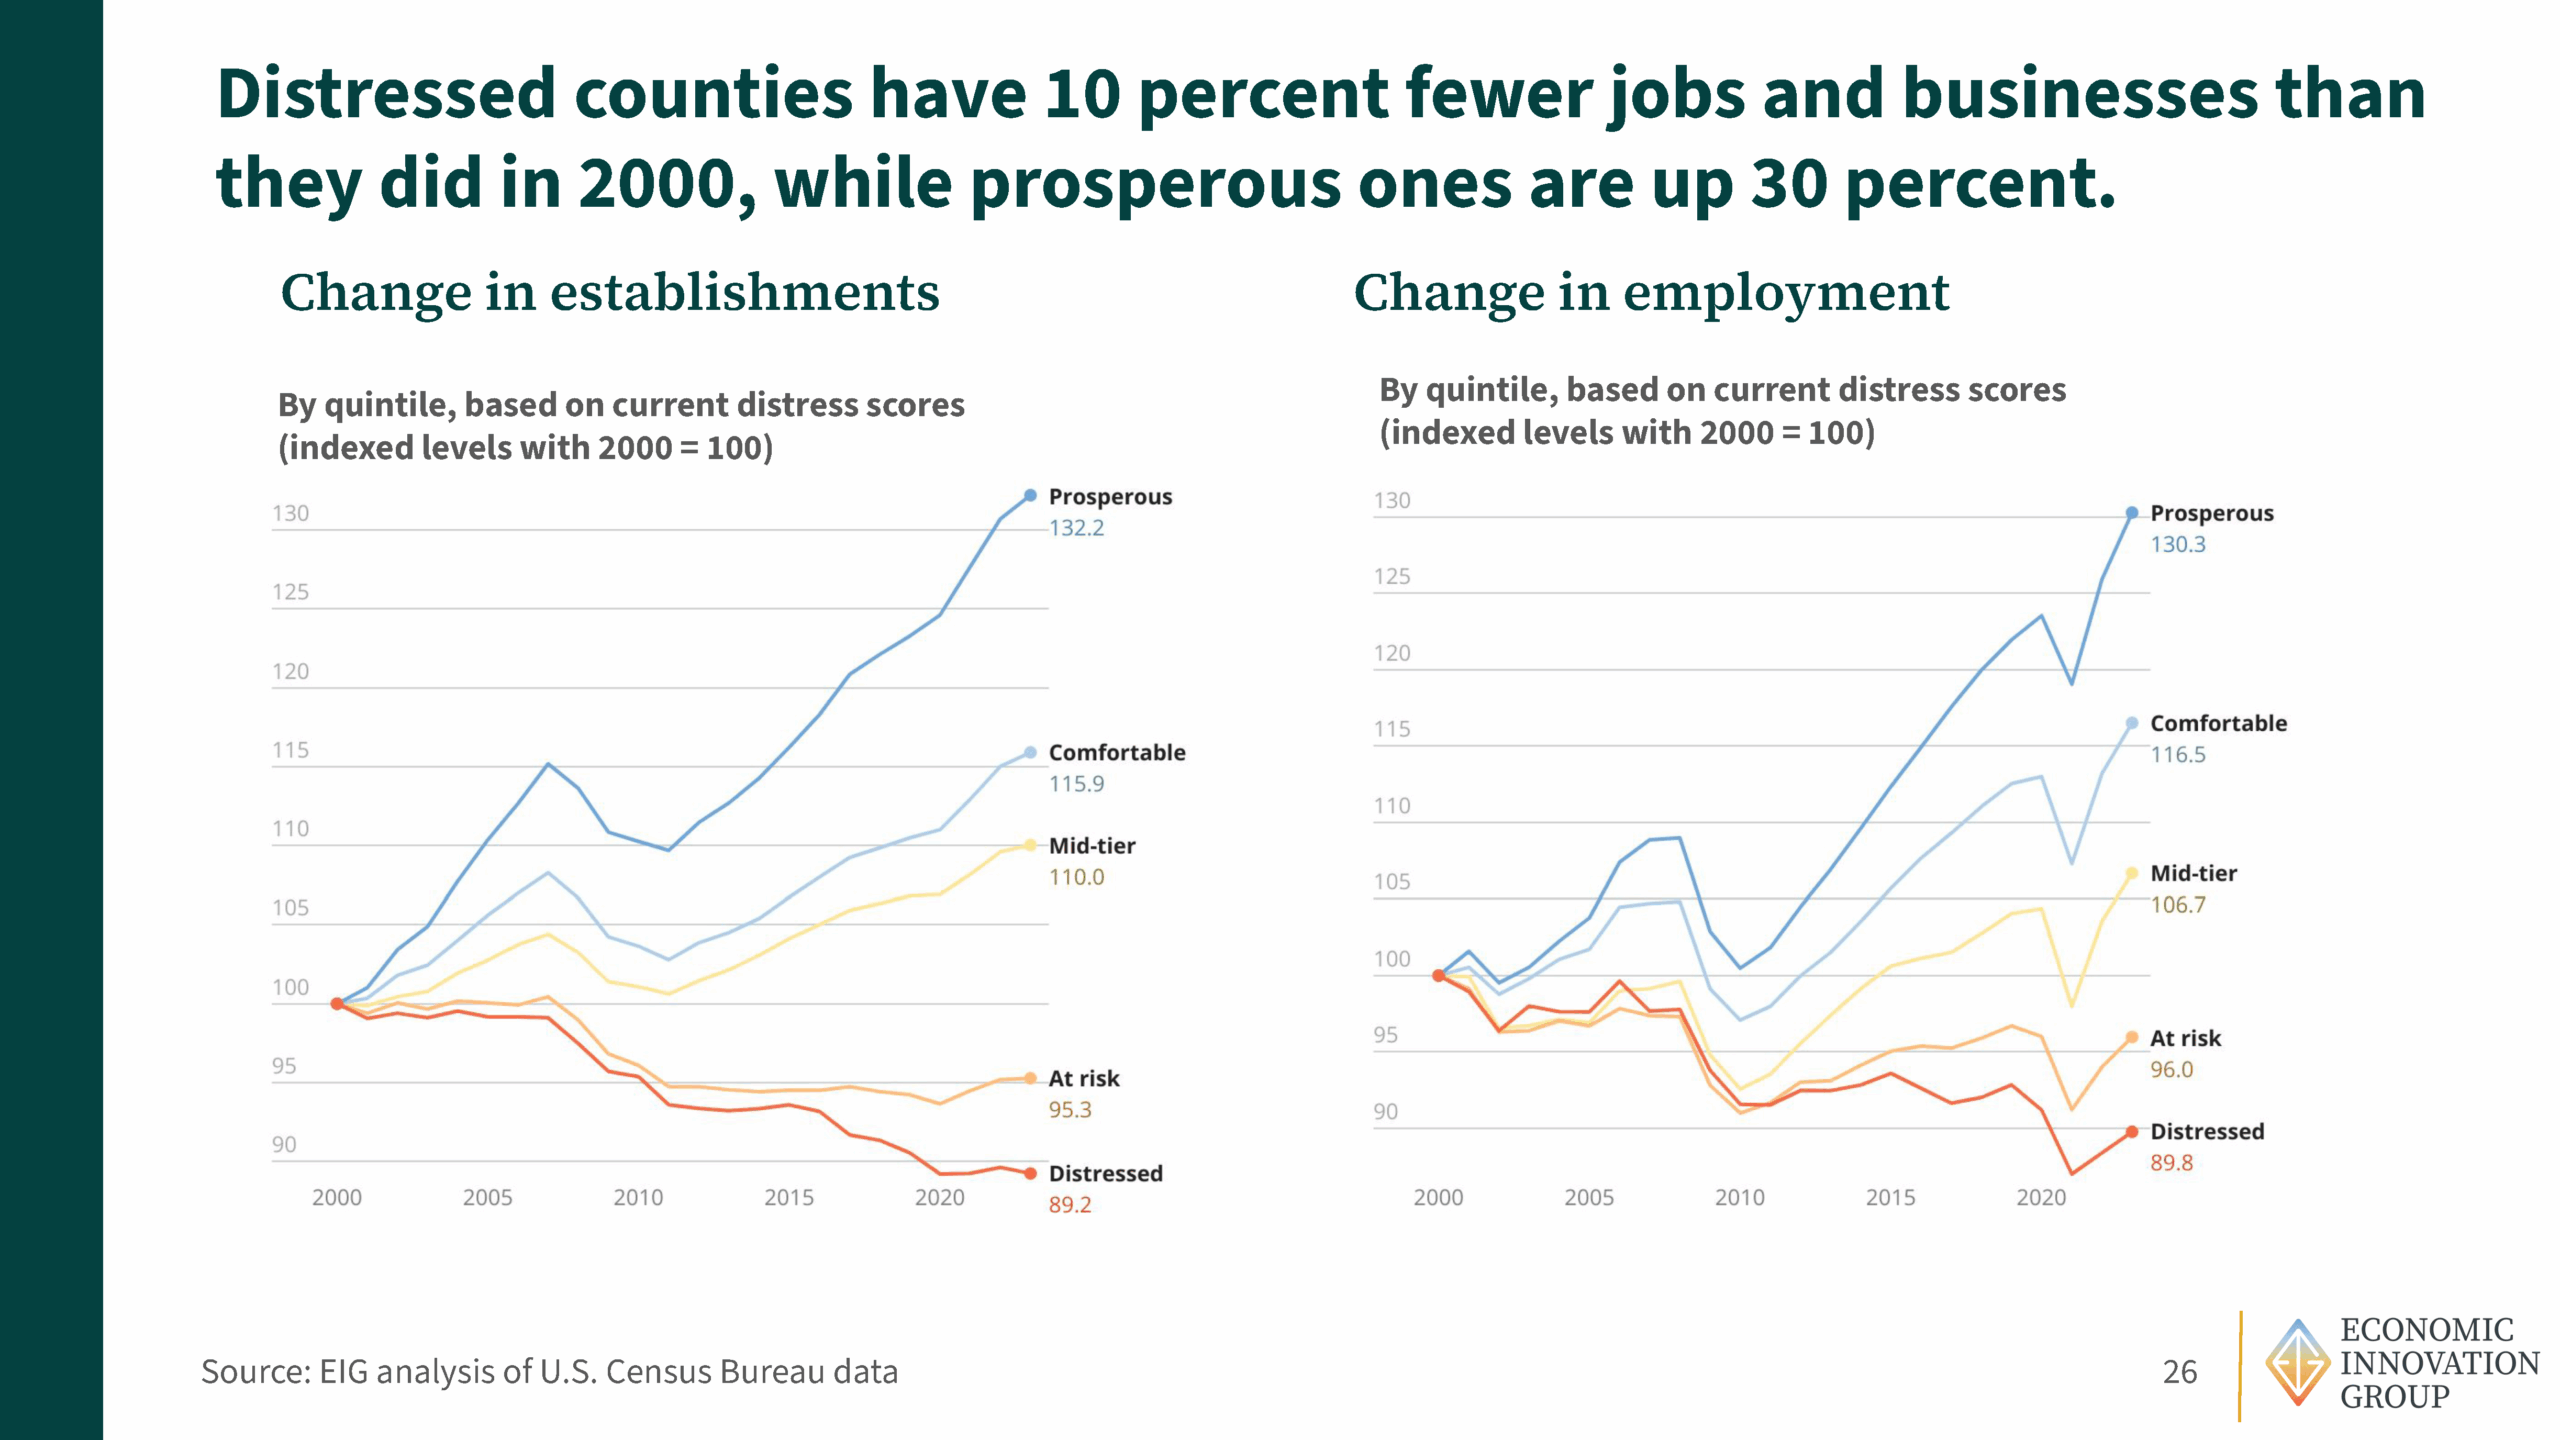
Controls for regional cost differences and indicates relative prosperity. - Employment Change
Percent change in the number of jobs over the past five years.
Signals local labor market dynamism. - Business Establishment Change
Percent change in the number of business establishments over the past five years.
Indicates the growth or decline of the local business ecosystem.
The DCI draws from the U.S. Census Bureau’s American Community Survey (ACS) 5-Year Estimates and County and ZIP Code Business Patterns datasets.
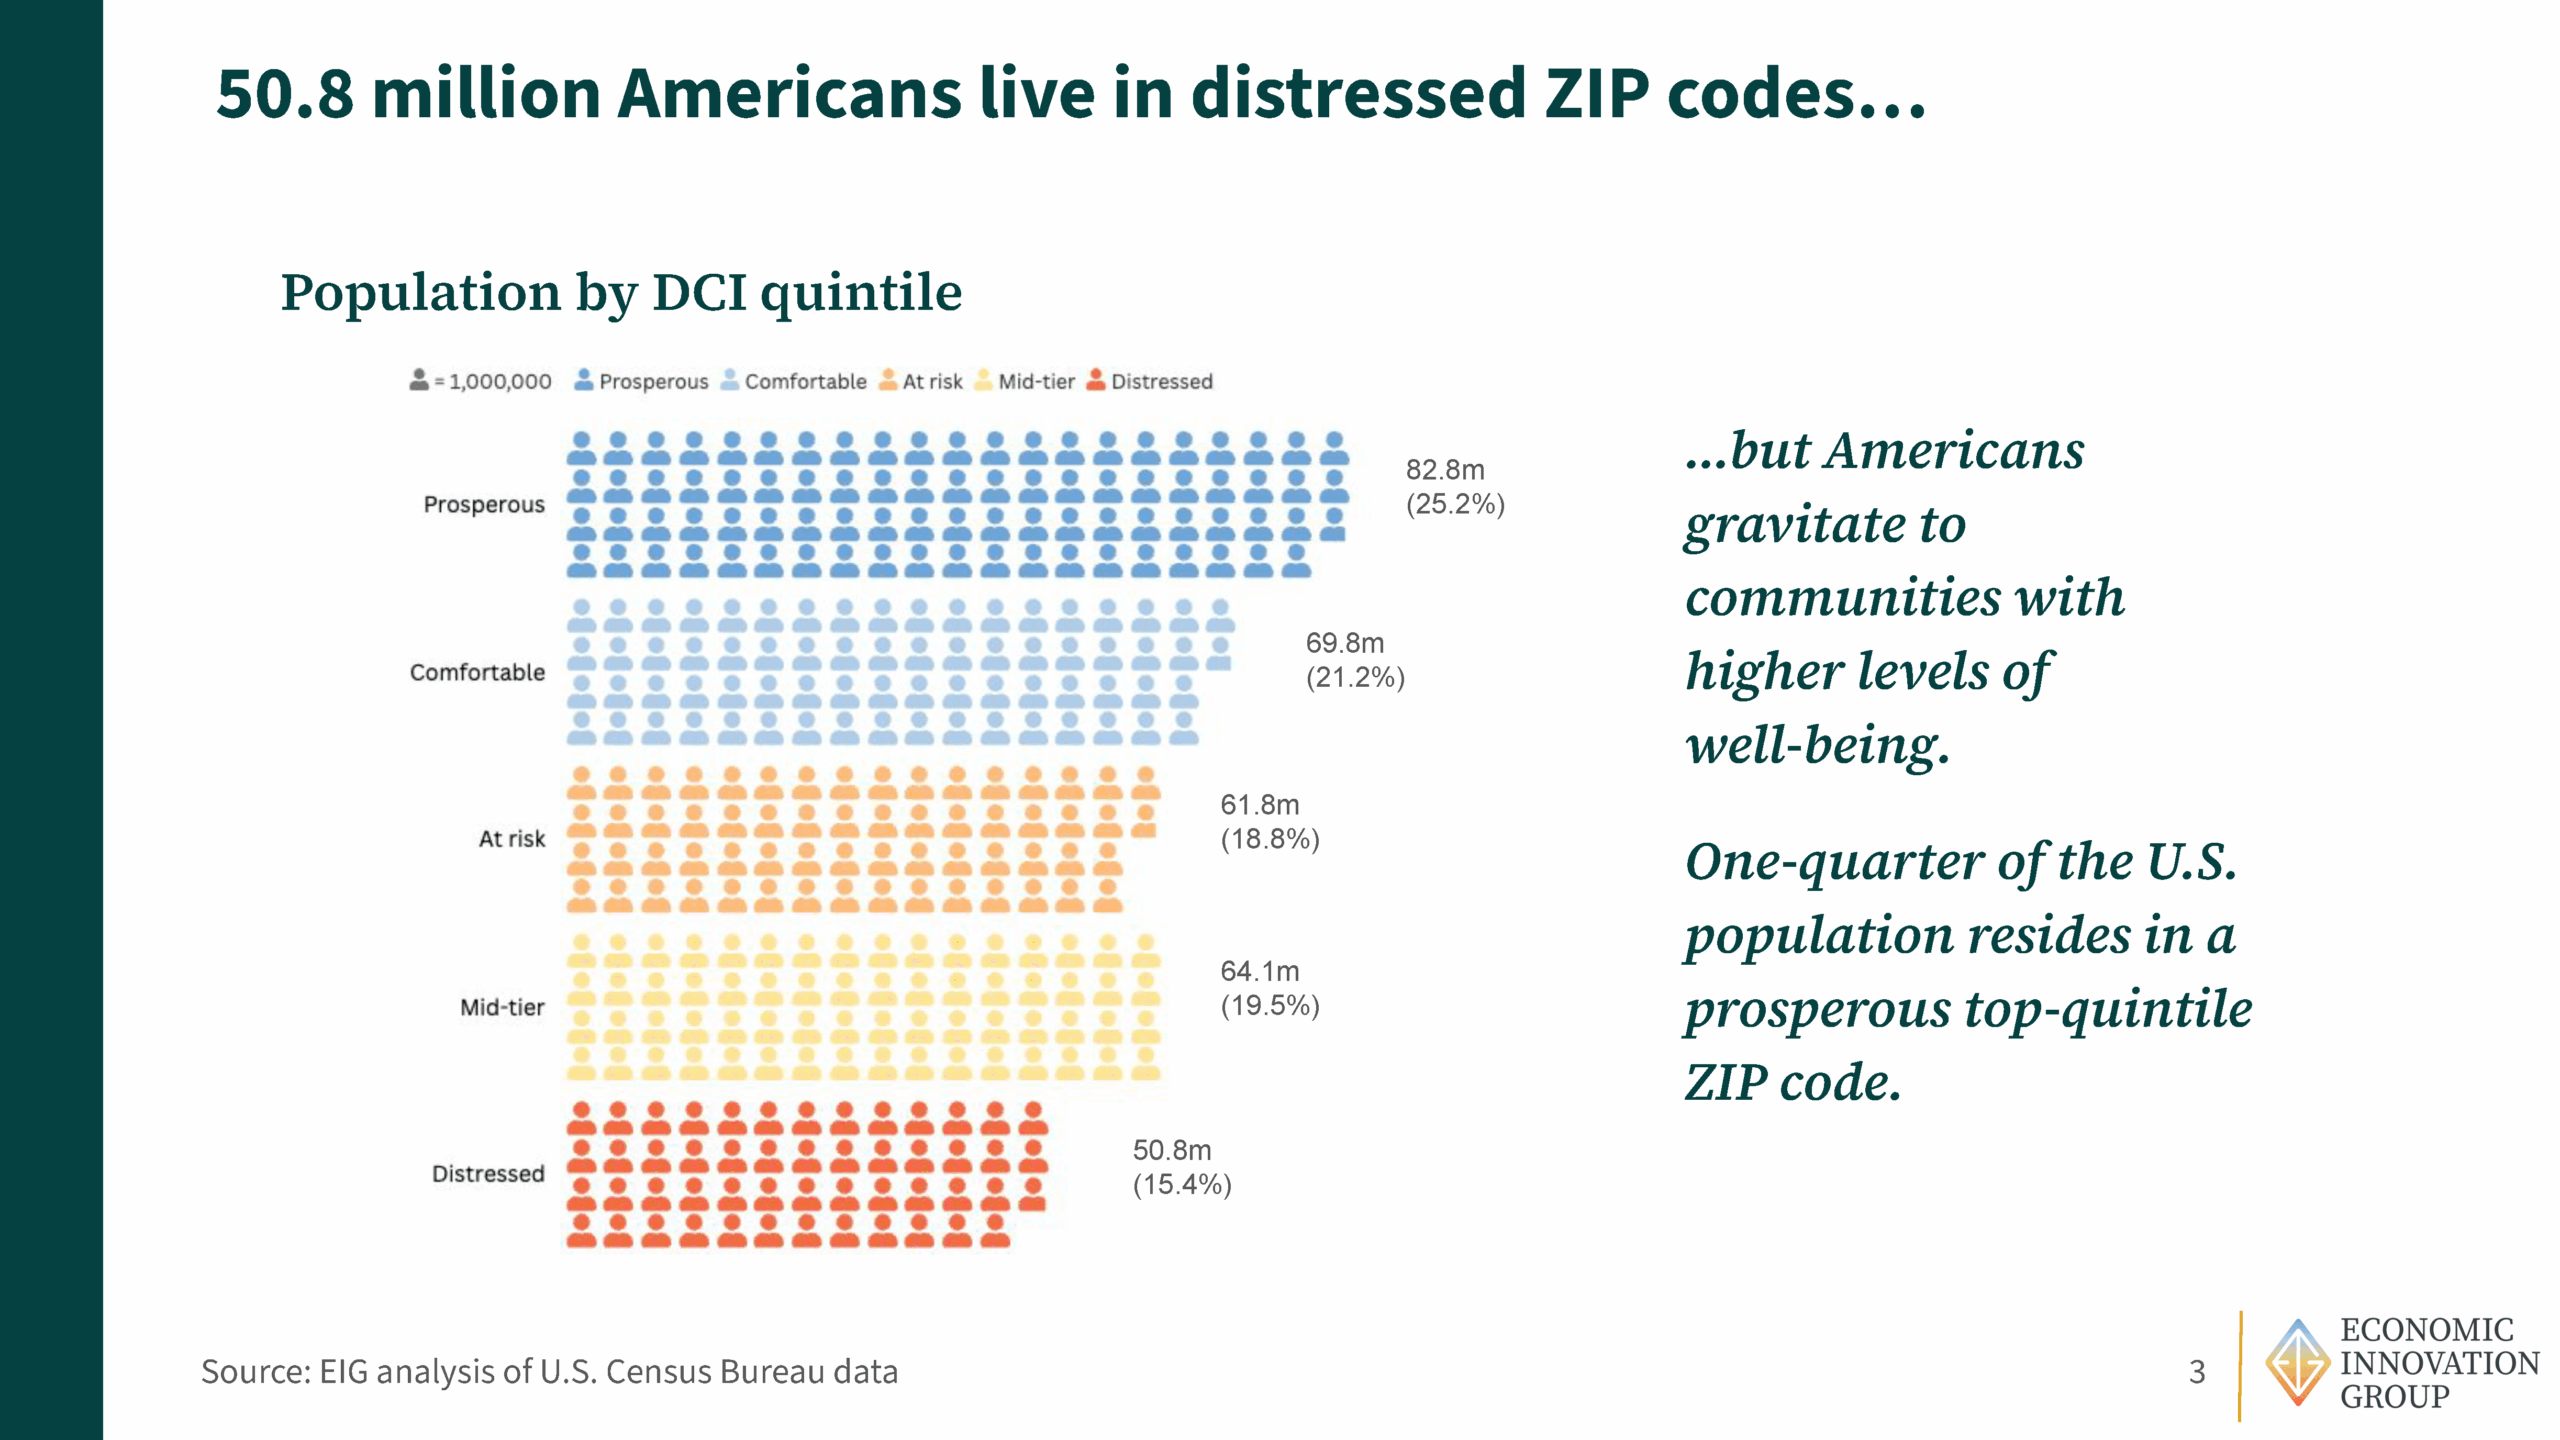
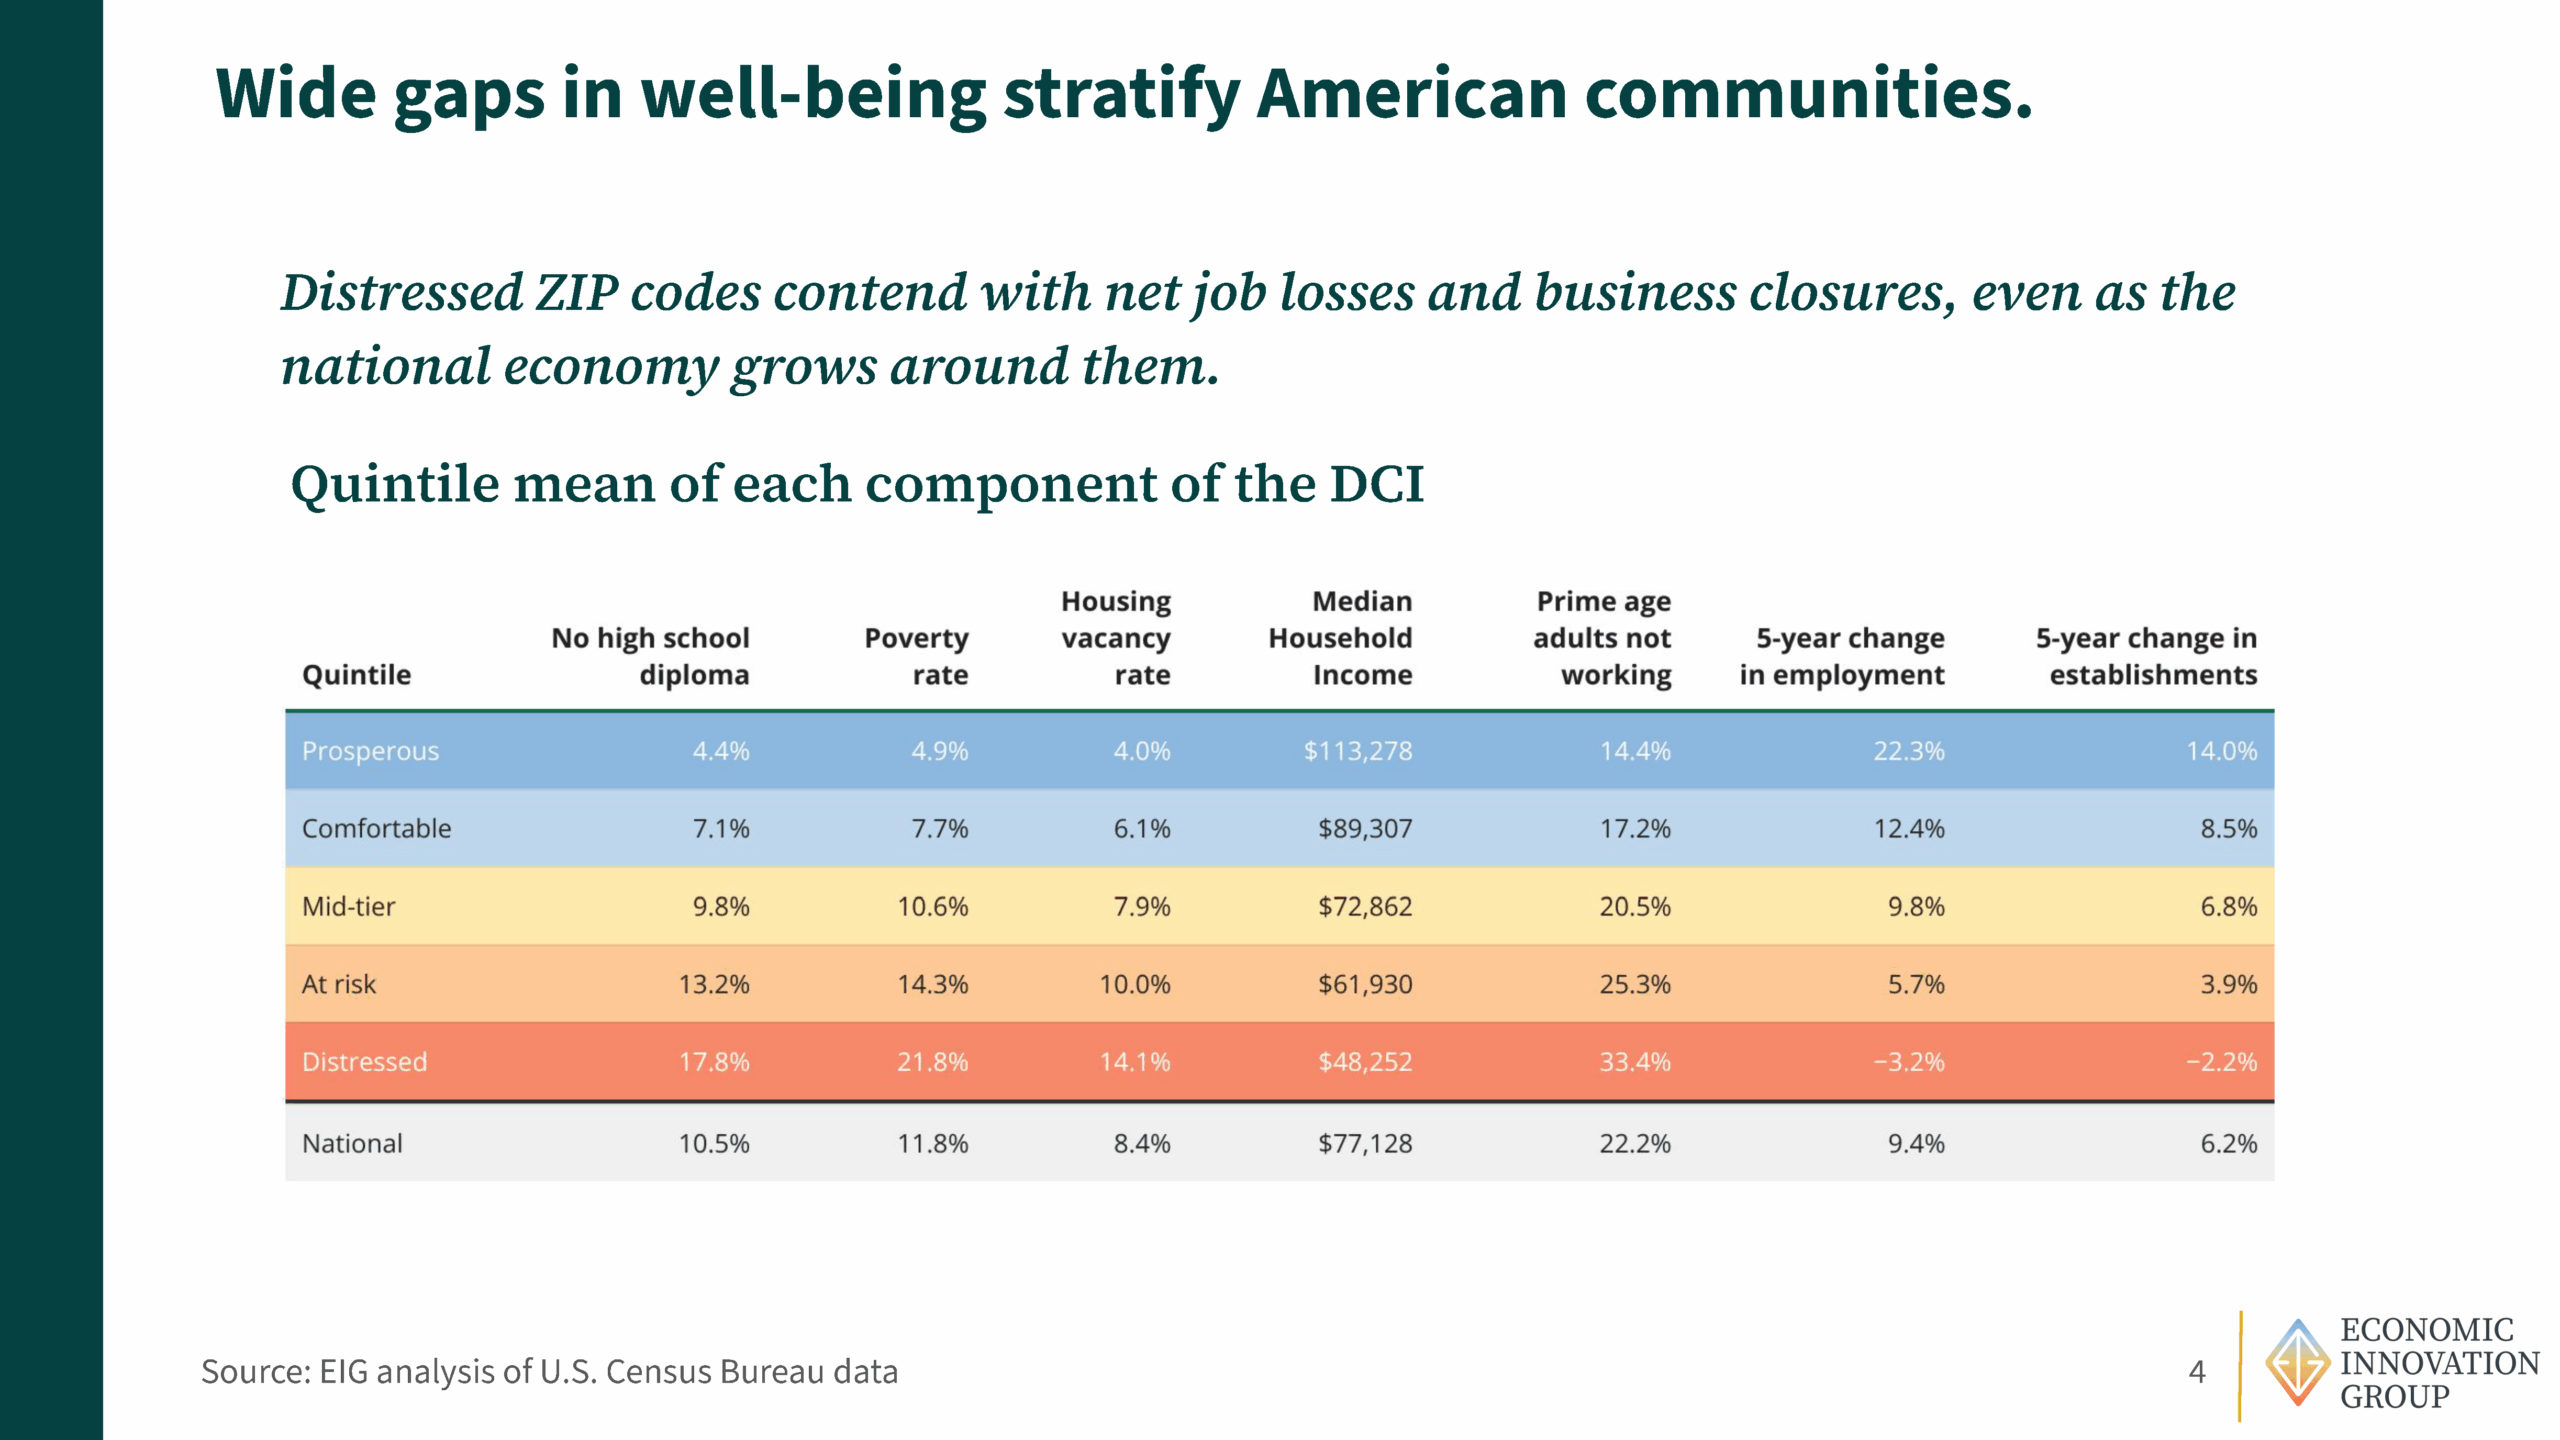
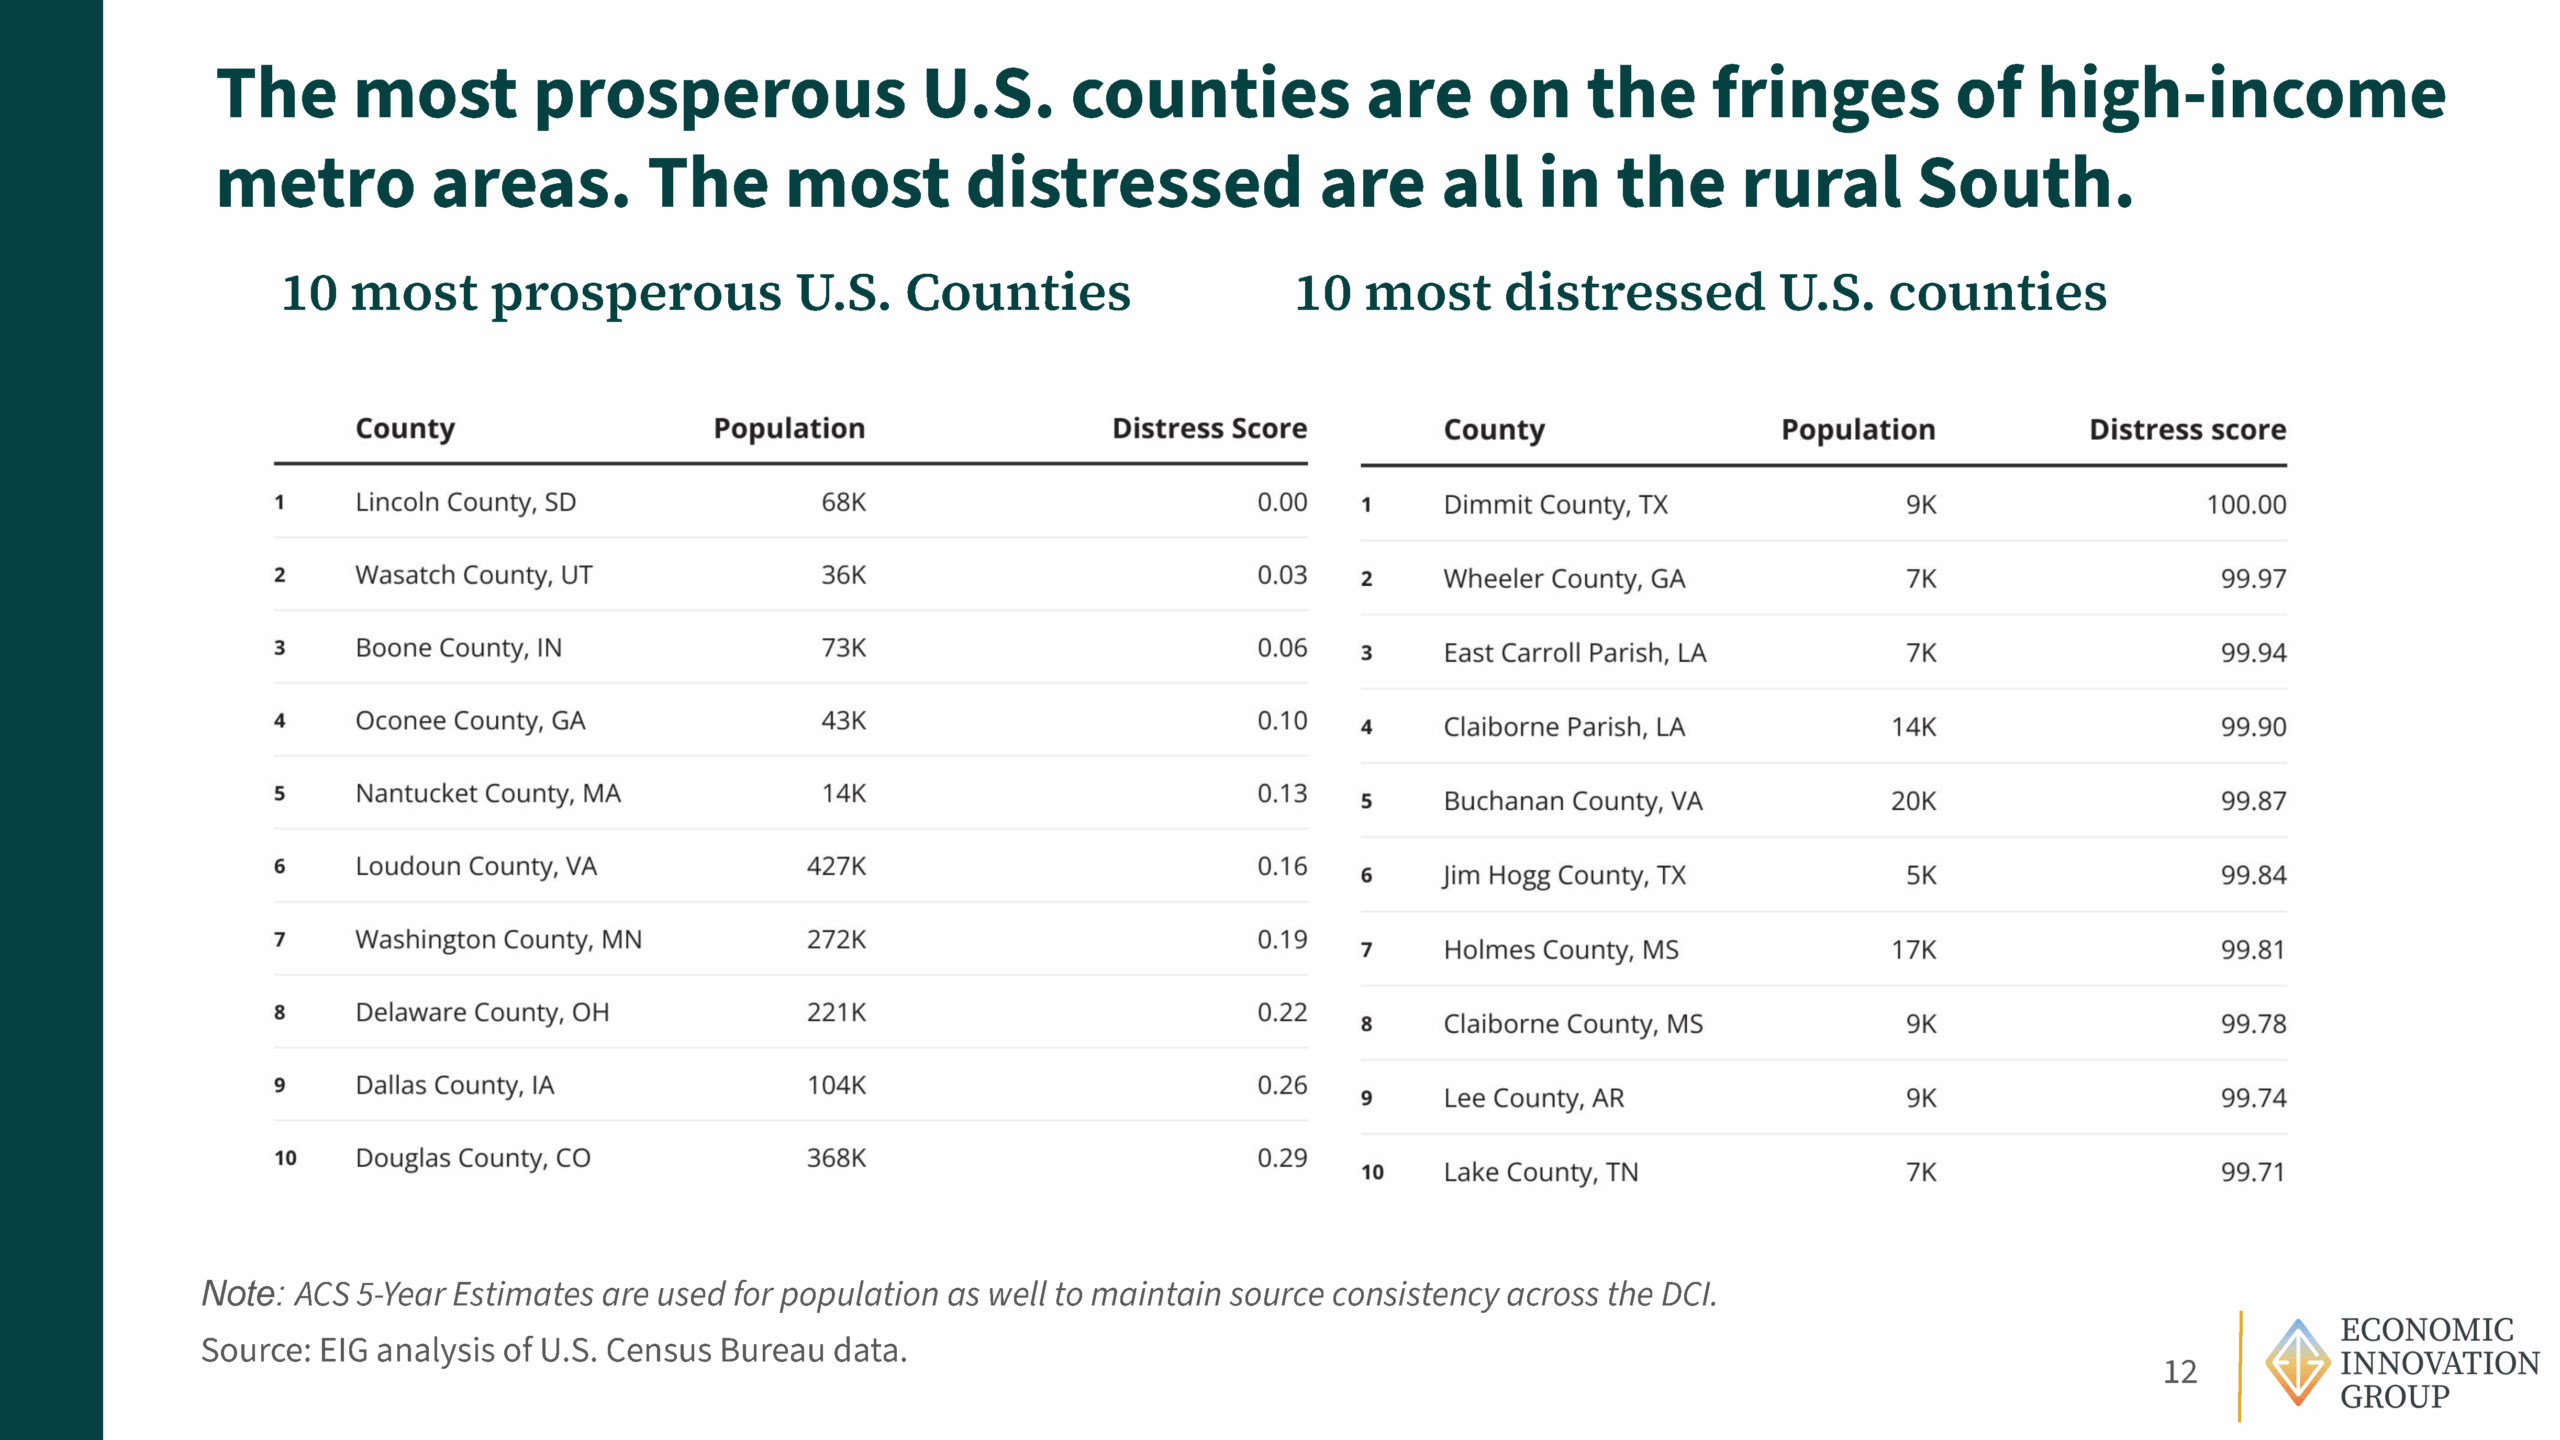
Scoring and Classification
Each community receives a distress score from 0 to 100, based on its average percentile rank across the seven equally-weighted indicators. A lower score signifies higher economic well-being; a higher score indicates deeper distress.
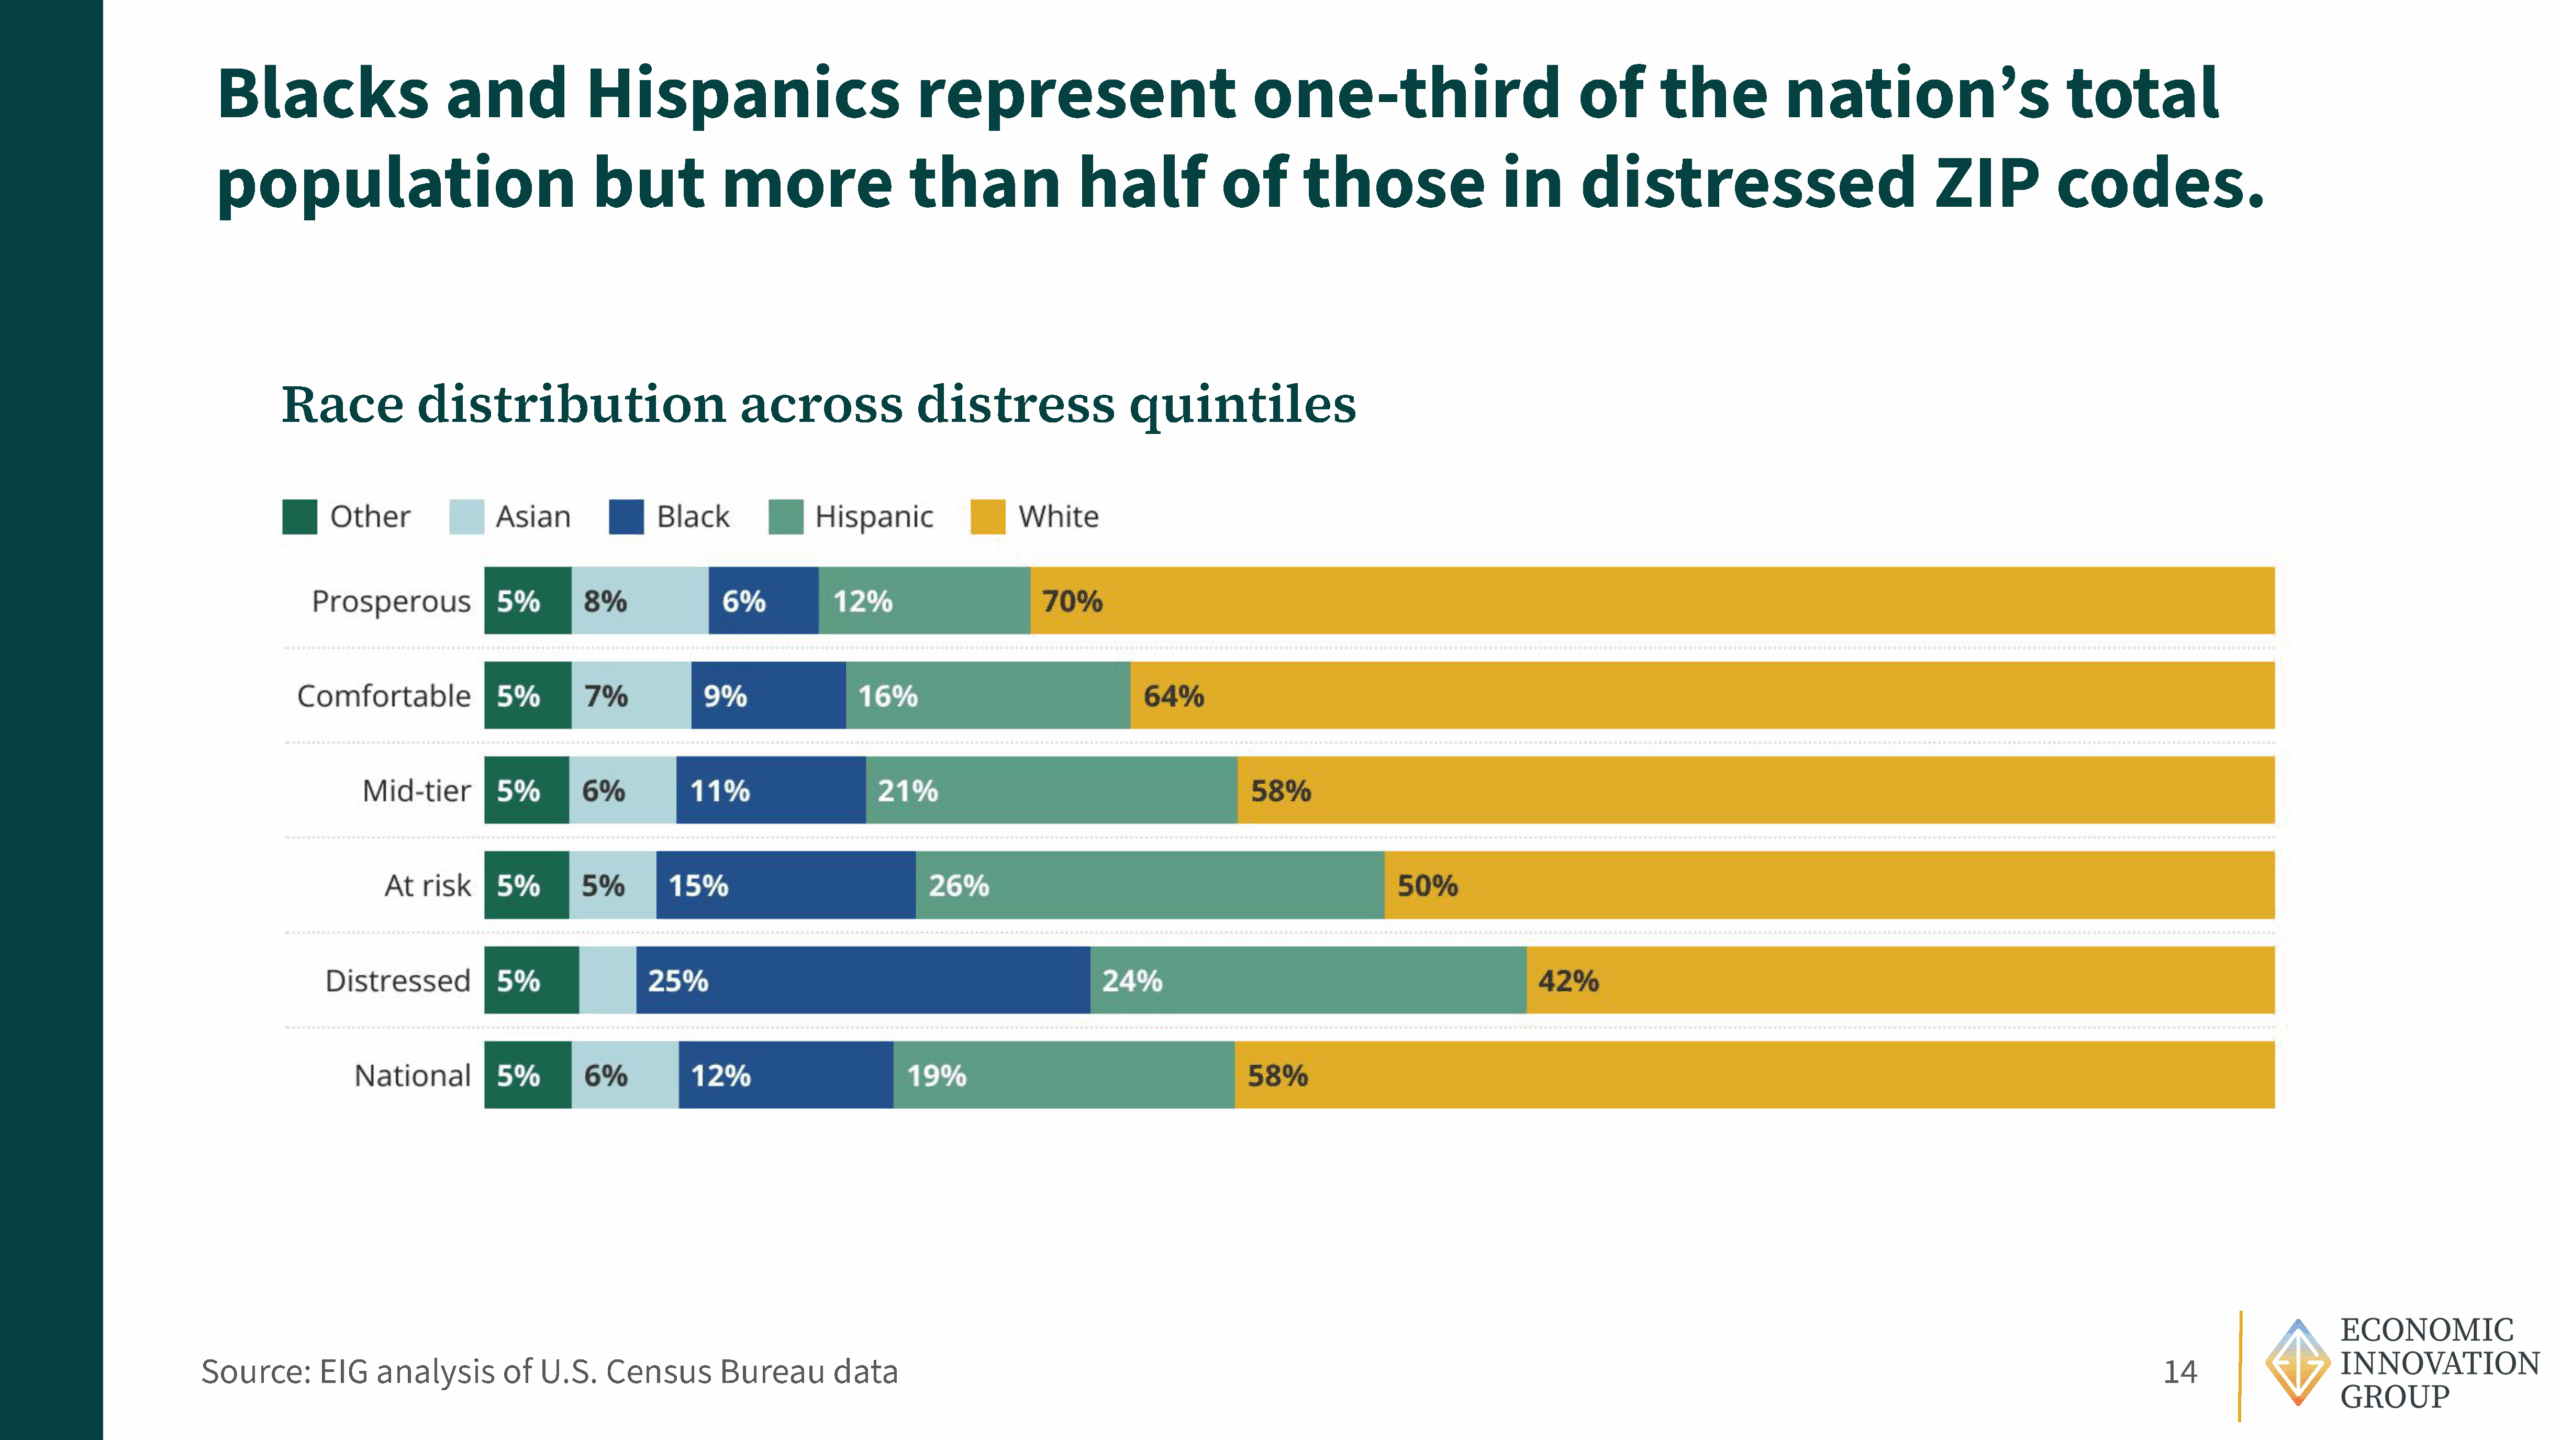
Communities are grouped into five categories based on their percentile:
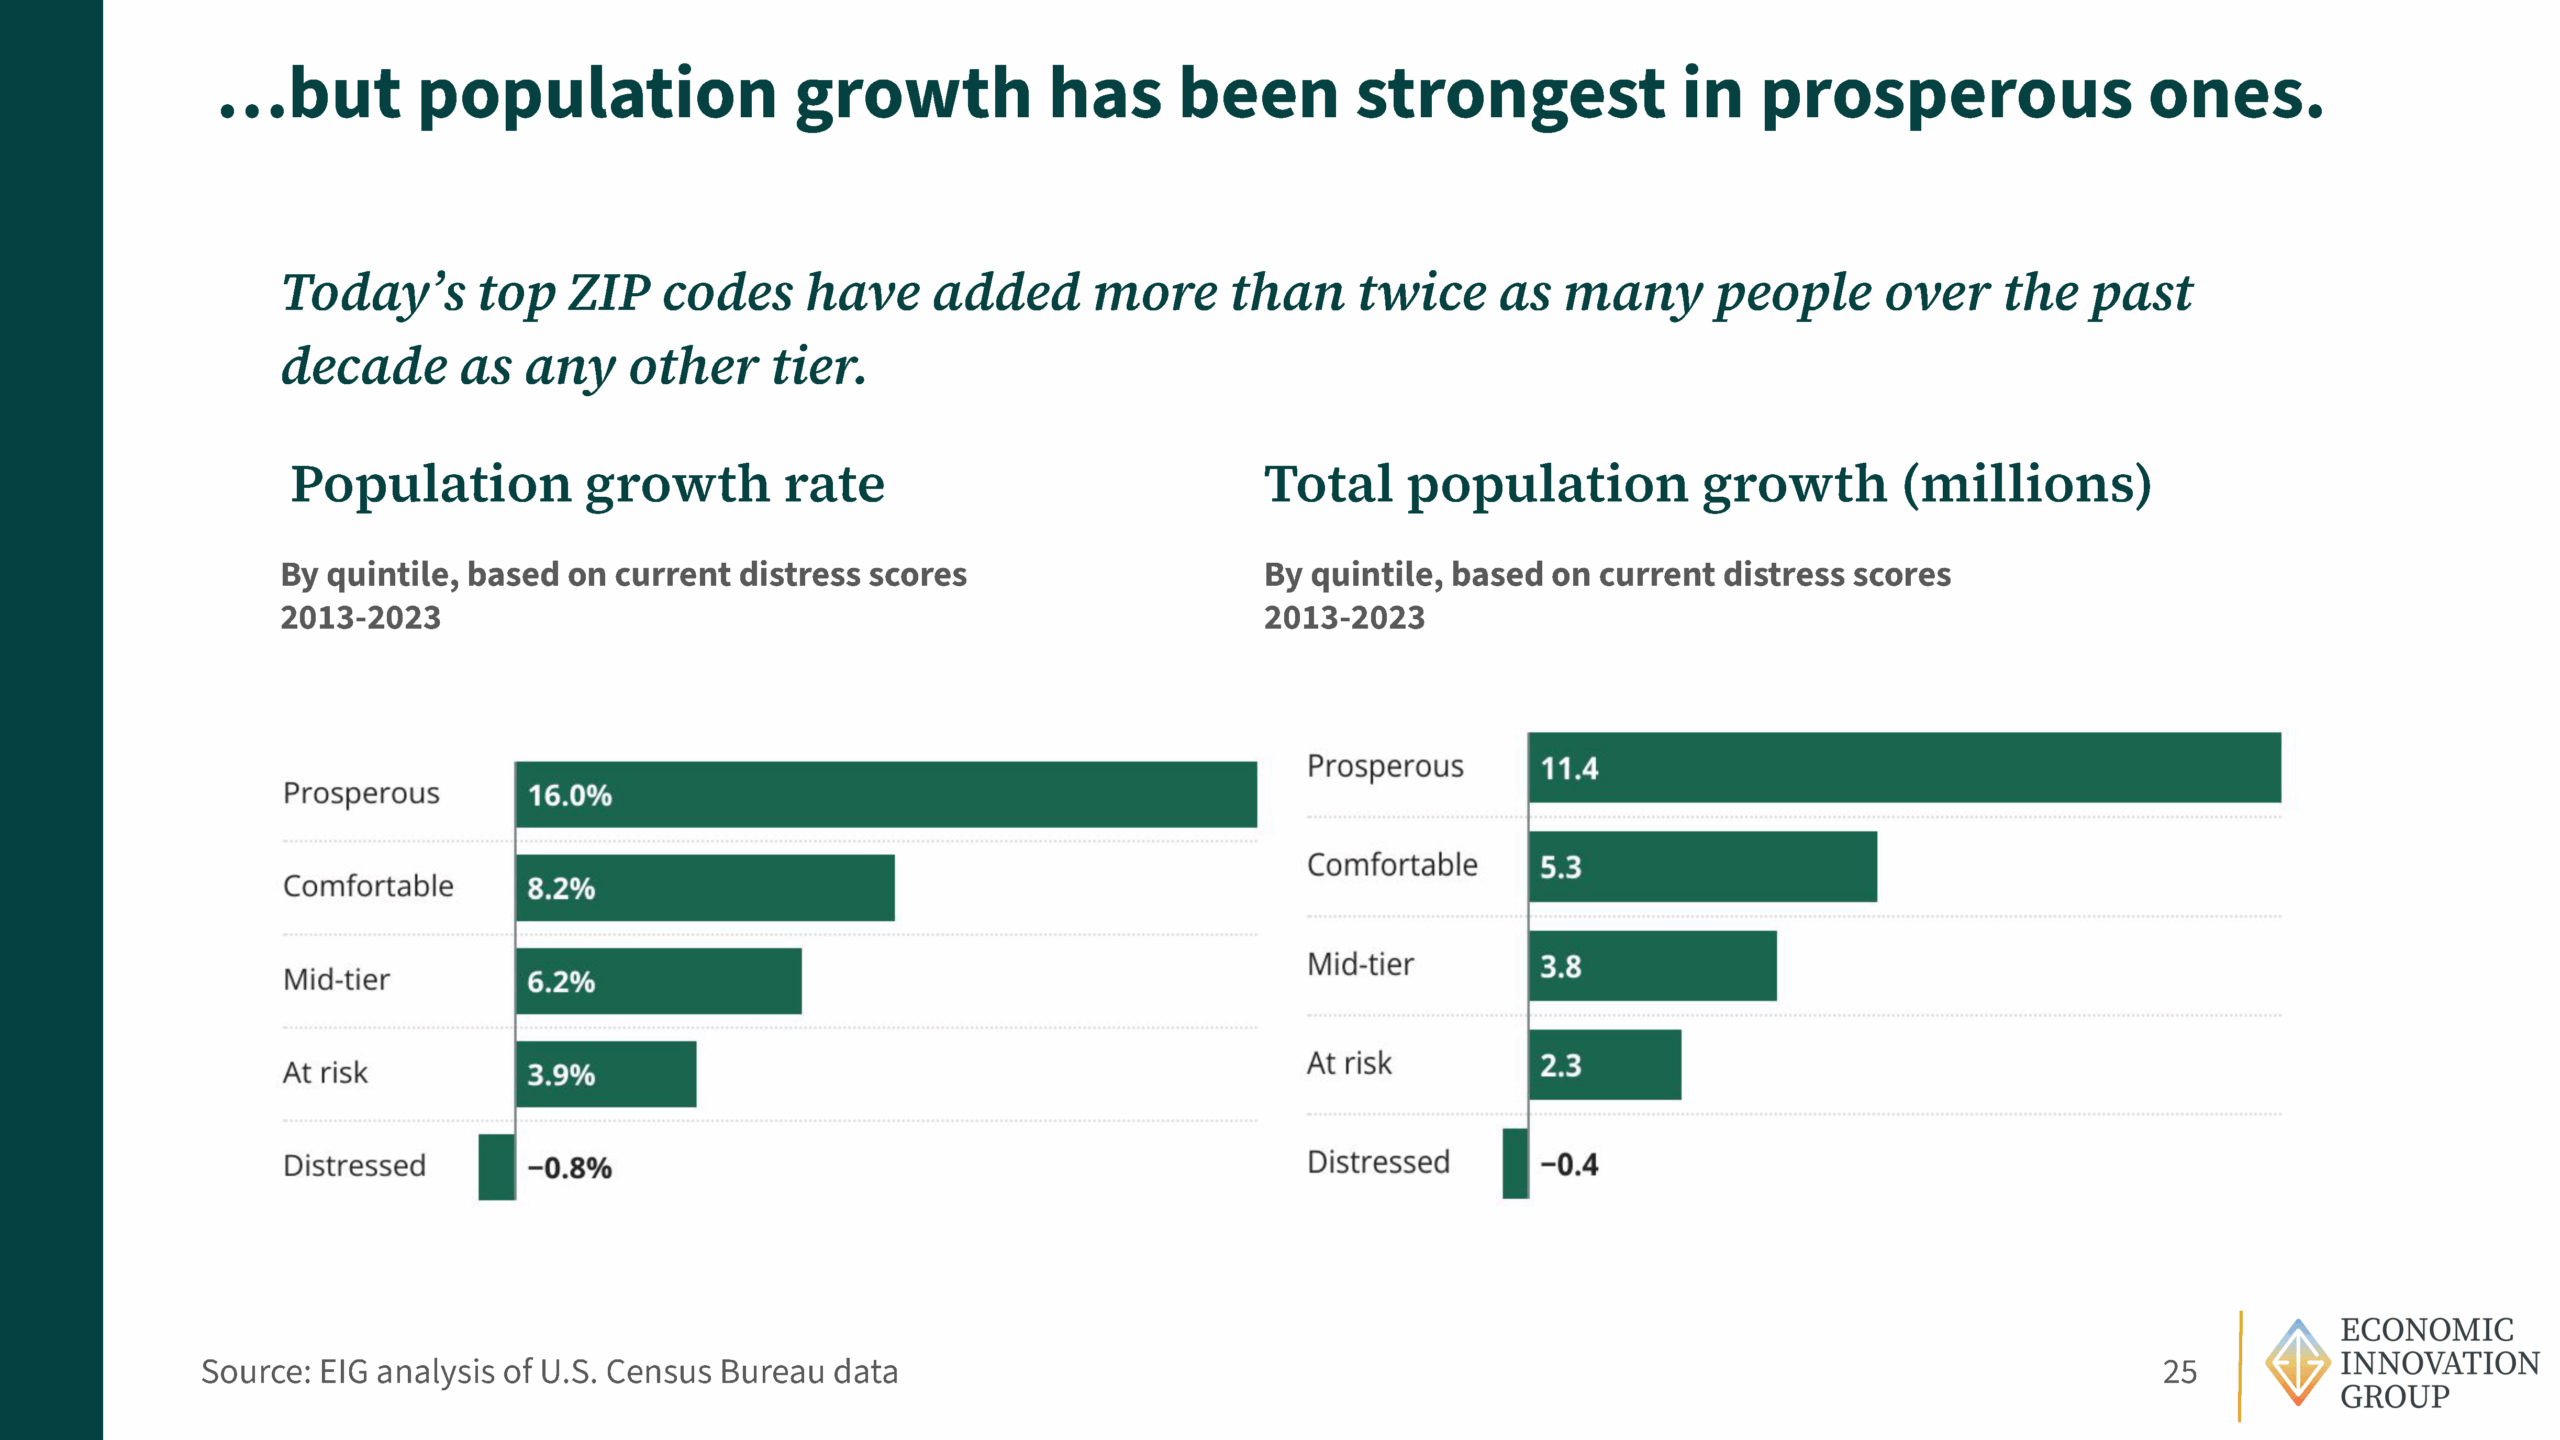
- Prosperous (0–20th percentile)
- Comfortable
- Mid-tier
- At Risk
- Distressed (81st–100th percentile)
This framework allows users to identify where a community falls within the broader national economic landscape. Learn more about the methodology behind the DCI here.
Geographic Coverage
The DCI is calculated across three levels of geography:
- ZIP Codes
Offers a neighborhood-level view of economic well-being across ~26,000 areas, covering 99 percent of the U.S. population. ZIP codes with fewer than 500 residents are excluded for data integrity. ZIP codes in which college students account for 50 percent or more of the population are excluded for the same reason. - Counties
Provides a broader view aligned with political and administrative boundaries. The county dataset is territorially exhaustive (covering the entirety of the map) and integrates easily with other government data. - Congressional Districts
Enables analysis of economic conditions within political constituencies, supporting research on governance, representation, and resource allocation.