
by August Benzow
Social connections and trust — often referred to as "social capital" — play a significant role in economic well-being and social mobility. Individuals with higher educational attainment and economic prosperity tend to have stronger social networks, while those facing poverty and hardship often experience weaker network connections. The extent to which individuals can leverage the resources provided by social capital also varies significantly from one neighborhood to the next.
Communities of color, particularly Black and Hispanic neighborhoods, face additional historical and systemic barriers that limit their access to "bridging social capital," or the connections that span socioeconomic lines. While exceptions exist, like New Orleans and Washington, DC, the map of economic distress and social capital reveals a stark correlation with race and ethnicity.
A novel combination of zip code-level datasets reinforces the connections between prosperity and social capital
Social capital is broken down into two core types:
- bonding, which links individuals within groups, and
- bridging, which connects people across divisions such as race, class, and education.
Bridging social capital has the most significant impact on upward mobility.[1] Building relationships that span socioeconomic divides can provide those disadvantaged at birth with access to the resources, opportunities, and support networks needed to ascend the economic ladder as they age. Children from low-income families could see a 20 percent average income increase in adulthood if they grew up in areas with economic connectedness typical of high-income families.[2]
The ability to track and analyze these cross-class friendships at the neighborhood level has long been hampered by data constraints. Leveraging Facebook user data, a groundbreaking social capital dataset from Raj Chetty and Opportunity Insights unlocks the potential for exploring bridging social capital at the zip code level.
The dataset quantifies the level of bridging capital for most zip codes with an economic connectedness (EC) value. EC is calculated by taking the average proportion of friends with above-median socioeconomic status (SES)[3] among people with below-median-SES and dividing it by 50 percent. The resulting value represents the degree to which people with a lower SES develop friendships with high SES individuals. A value of 0 indicates no friendships across the SES median, while a value of 1 suggests that low-SES individuals have an equal number of high- and low-SES friends. Any values above 1 indicate a higher prevalence of connections with high-SES individuals for those with lower SES.
To explore the reciprocal relationship between economic distress and social capital at the community level, this analysis combines this Opportunity Insights database with the Economic Innovation Group's Distressed Communities Index (DCI). The DCI sorts communities into five tiers of well-being (prosperous, comfortable, mid-tier, at risk, and distressed) based on seven economic indicators. When combined with the Opportunity Insights data, the DCI exposes how economic, social, and demographic forces shape the level of social capital in different communities.
High economic distress goes hand in hand with few cross-class friendships at the neighborhood level
Most distressed communities across America are doubly disadvantaged – not only economically but also in their isolation from opportunity. A nationwide zip code analysis uncovers a troubling trend: the more distressed a neighborhood, the fewer its residents' connections bridging the class divide. This absence of cross-class social capital compounds the uphill battle facing those struggling in society's most left-behind areas.
Tens of millions of Americans bear the burden of social and economic isolation. More than two-thirds (69 percent) of residents in distressed communities find themselves living in zip codes with the lowest levels of economic connectedness (bottom 20 percent). This translates to roughly 34 million people, representing approximately 10 percent of the US population. At the other end of the spectrum, prosperity and strong social connections often go together, although the connection isn't as absolute. Half of residents in prosperous communities reside in zip codes with the highest economic connectedness (top 20 percent), totaling 39 million individuals.
These findings underscore a sobering reality: It is exceedingly rare for the nation's most economically distressed communities to exhibit robust cross-class connectivity. At one extreme are prosperous communities with high rates of bridging social capital that facilitate upward mobility. At the other extreme are distressed communities with a scarcity of opportunity-catalyzing relationships across class boundaries. This divide reveals how the erosion of the American Dream occurs through the compounding forces of economic hardship and limited access to social networks that pave the way for advancement.
Thriving and struggling communities are worlds apart
The typical prosperous zip code has an EC value of 1.1 compared to 0.7 for the average distressed community. This gap is substantial, but even more striking is the vast difference between the extremes: the most prosperous and connected zip codes are worlds apart from the most distressed and least connected ones.
South Bay (33493) and Belle Glade (33430) in the Miami metro area suffer from exceptionally few economic connections between low- and high-income residents, ranking second and third lowest in the country. These mostly Black and Hispanic distressed communities also have some of the highest rates of poverty and prime-age adults out of work nationwide.
Despite technically belonging to a major metropolitan area, these agricultural communities bordering Lake Okeechobee face unique challenges. Separated by 25 miles of wetlands and farmland from the exurbs of Miami, they grapple with isolation and limited opportunities to build bridging social capital. These communities exemplify the struggle faced by many residents of deeply distressed communities who lack the connections crucial for upward mobility and well-being.
While zip codes experiencing deep economic hardship often lack connections across income levels, wealthier areas exhibit higher rates of cross-class friendships. Notably, all ten zip codes with the highest "economic connectedness" levels are clustered in California's Silicon Valley. Examples include Palo Alto (94301) and San Francisco's Marina District (94123), both characterized by high median incomes and educational attainment.
Bridging capital is not just concentrated at the top of the income distribution but also spatially. Opportunities for low-income residents to connect with higher-income individuals tend to be greater in areas with widespread prosperity, like Silicon Valley, compared to those facing deep economic hardship, like Belle Glade.
Stronger connectedness is linked to specific demographics and regions
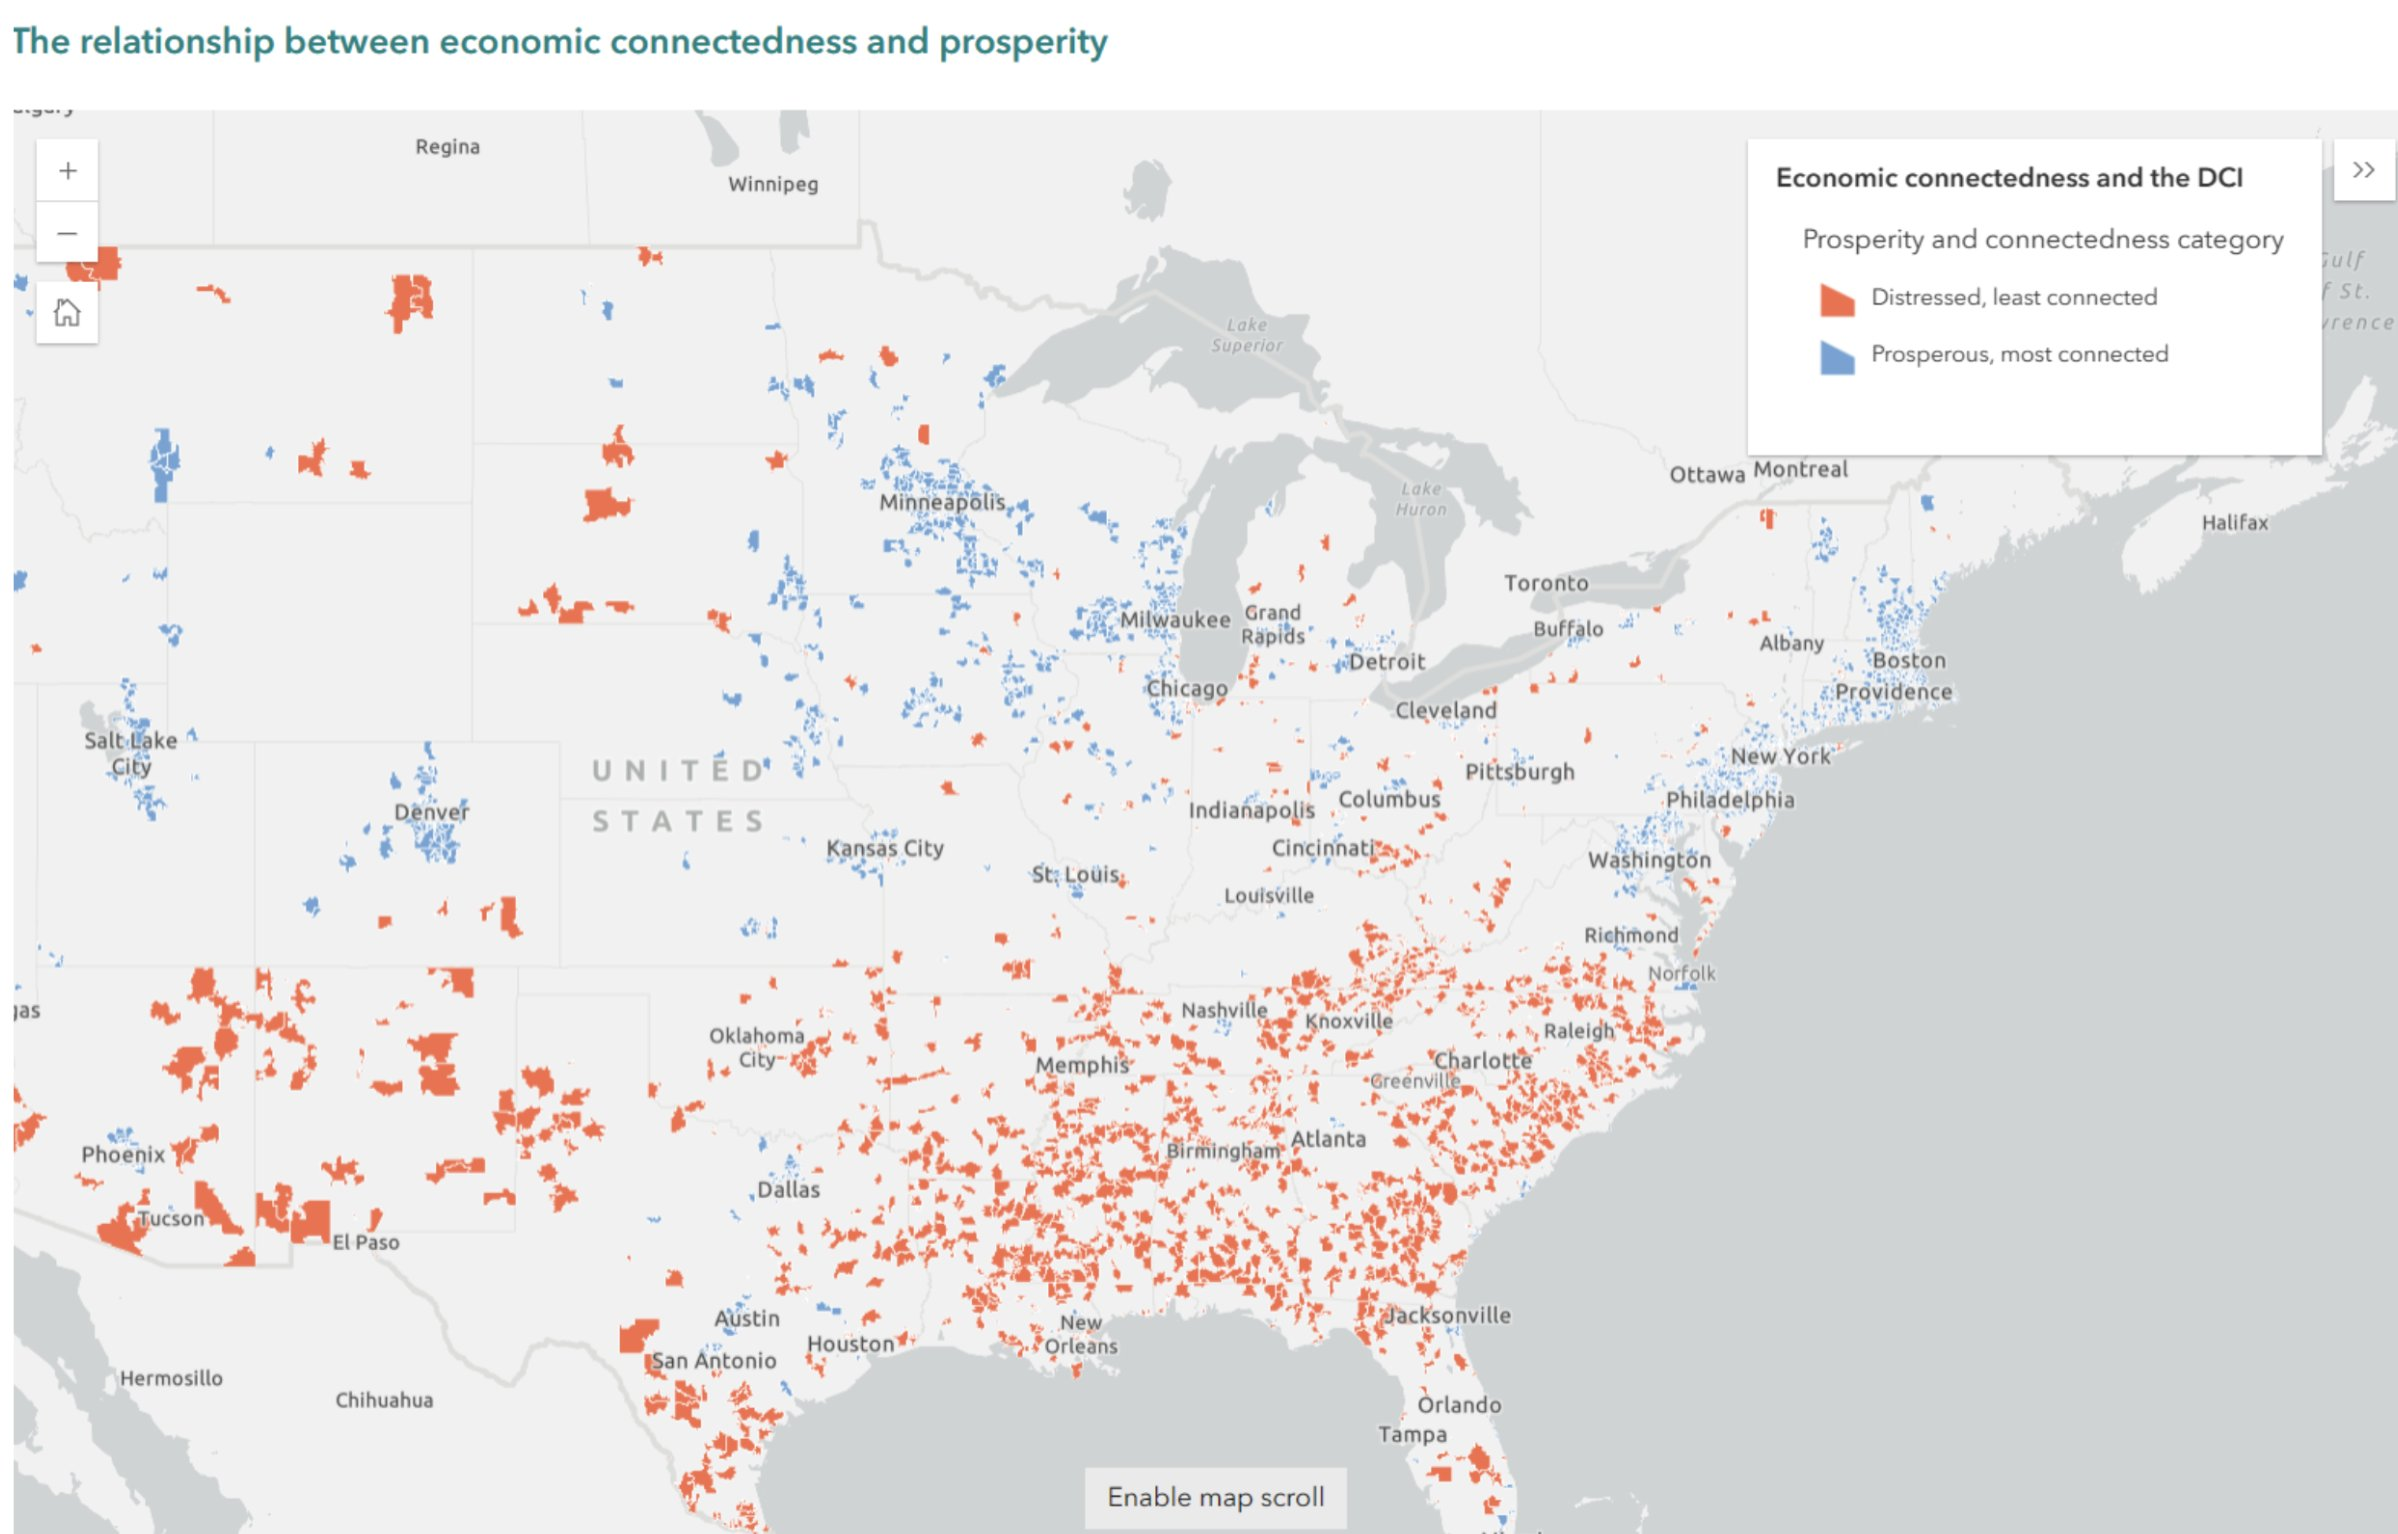
Geographic disparities in bridging social capital become strikingly apparent when mapping the economic connectedness divide alongside levels of community distress. As the map below shows, zip codes in the bottom fifth for connectedness and classified as distressed by the DCI cluster heavily in the South. Conversely, prosperous zip codes ranking in the top 20 percent for connectedness concentrate in the Northeast, Upper Midwest, and Mountain West.
The Southeast, often heralded for its economic growth, appears to be a paradox when it comes to social mobility. Despite economic strides, a significant portion of the region lacks the social connections crucial for upward mobility. In five states – New Mexico, Louisiana, Mississippi, Alabama, and South Carolina – more than a quarter of zip codes languish in the bottom quintile for both economic connectedness and distress. Except for New Mexico, these states form a contiguous stretch across the Southeast.
As the map illustrates, this dearth of cross-class connectivity plagues predominantly rural areas throughout the Southeast. However, zooming in closer reveals urban cores are not immune either, with pockets of isolation pockmarking major urban centers. Memphis epitomizes this disconnect, with a staggering two-thirds of its zip codes ranking among America's most economically deprived areas while also scoring in the bottom fifth nationally for friendships across class lines.
The economic and social landscape outside the South paints a contrasting picture. In Utah and New Hampshire, a robust 40 percent of communities fall within the top quintile for both economic connectedness and prosperity. Massachusetts follows closely behind at 34 percent. The Midwest also exhibits pockets of economic potential, with Minnesota the leader. Nearly 28 percent of its zip codes rank in the highest tier for both metrics, with Wisconsin not far behind.
These regional bright spots align with prior research[4] highlighting the Midwest's and Great Plains' abundance of social capital. The implication here is that strong social connections, regardless of their root cause, might act as a buffer against the detrimental effects of economic hardship on social capital, especially in regions with concentrated prosperity.
The role of race and ethnicity in explaining these regional variations in economic connectedness warrants further exploration. States with strong economic connections, like Wisconsin and New Hampshire, also have relatively homogenous populations that are nearly all non-Hispanic white. In contrast, states with fewer cross-class connections, like South Carolina, tend to be more diverse. This pattern tracks with research showing that high social capital tends to be found in racially homogeneous (mostly white) states. In contrast, states with high racial/ethnic diversity tend to have low levels of social capital.[5]
While this correlation defies a straightforward explanation, the country's long history of inequality and segregation based on race and ethnicity clearly plays an important role. In both rural and urban settings, many low-income Black Americans have become stuck in economically distressed neighborhoods that offer few opportunities to build bridges across barriers of both race and social class. Other minority groups face similar challenges. Milwaukee's predominantly Black and Hispanic distressed zip codes, for example, exhibit below-average connectedness, diverging from the statewide trend.
Across the entire DCI spectrum, economic connectedness is lower in Black and Hispanic communities
Communities with a higher proportion of Black or Hispanic residents (1.5 times the national average) tend to have lower EC scores, regardless of their overall economic standing. At the very bottom of the economic well-being distribution, the average distressed community with a high Black share has an EC significantly lower than a distressed zip code that is primarily white or has a high Asian American and Pacific Islander (AAPI) population.
The typical low-SES resident of a mostly non-Hispanic white and prosperous community has an equal mix of low- and high-SES friends. Compare this to the average prosperous community with a high Black share, where its EC value dips below the median for all zip codes. While the correlation between individual race/ethnicity and EC value is weak (compared to factors like education and income), these findings point to disparities in economic connectedness across different demographics.
Even though majority Black communities tend to have fewer economic connections than their mostly white counterparts, there are notable exceptions. The following two local vignettes from Washington, DC, and New Orleans, LA, showcase distressed neighborhoods with large Black populations that also exhibit high levels of cross-class friendships.
Social connections can also vary widely across communities with similar economic status
While economic well-being often correlates with the level of social connections within a community, this relationship isn't always straightforward. While rare, some distressed areas exhibit surprisingly high levels of economic connectedness, while low-income residents in prosperous communities can have very few cross-class friendships.
While the extremes clearly demonstrate how prosperity and economic connectedness are linked, some zip codes defy expectations, showcasing the complex interplay of demographic and socioeconomic factors and how a community can succeed in spite of limited bridging social capital. For instance, while Hialeah, FL (33018), is a prosperous community in the Miami metro area, it has a meager EC value of .56–below the average for distressed communities.
What factors might explain this low value? Unlike many prosperous zip codes, Hialeah has lower educational attainment rates (comparable to the average for a mid-tier zip code), and 39 percent of its residents make less income than the state median. It is also an immigrant community: two-thirds of Hialeah's population identifies as Cuban, and almost the same share are foreign-born. Research shows that immigrants with less education tend to have lower social capital.[6] Despite its low levels of cross-class friendships, the community ranks as prosperous in the DCI primarily due to high prime-age employment rates and robust growth in jobs and businesses.
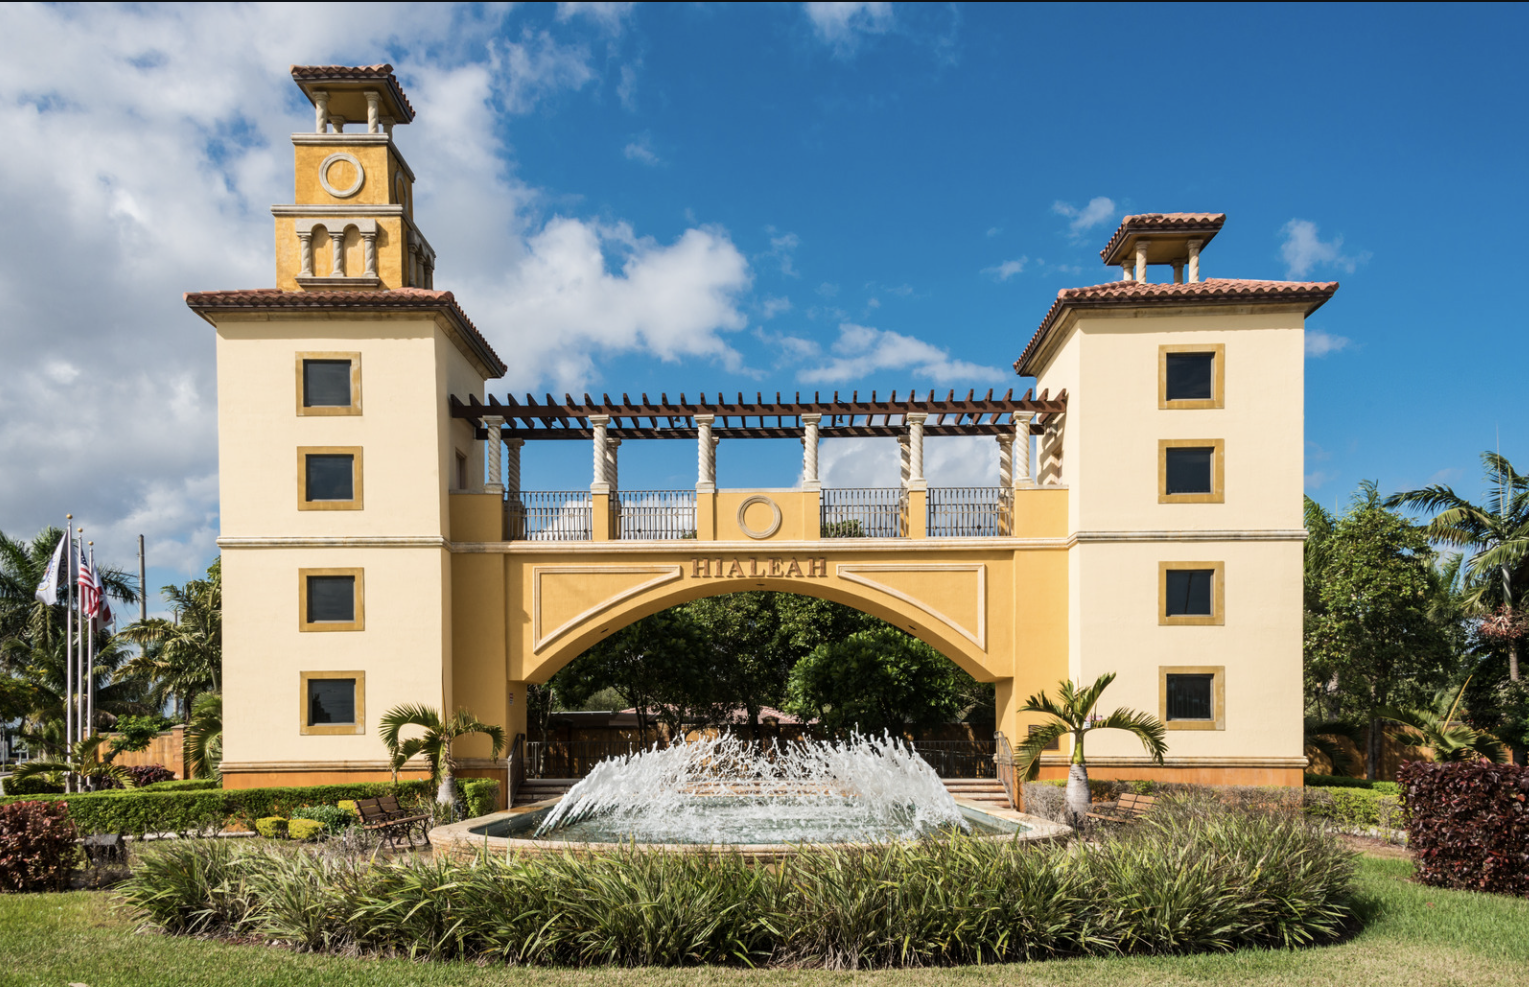
Municipality building in Hialeah, FL
On the other side of the country, zip code 94108, which includes parts of San Francisco's Nob Hill neighborhood and the city's Chinatown, continued to see its DCI score worsen in recent years. This downward slide was primarily due to job and business losses stemming from the COVID-19 pandemic and resultant policies. Despite ranking near the bottom of the distressed quintile, it maintains an especially strong EC value of 1.4.
Like many urban zip codes, pockets of prosperity in this neighborhood exist alongside significant economic hardship. Nearly half its inhabitants are immigrants, predominantly Chinese, many of whom lack a high school diploma. While nationally, Asian households tend to have higher average incomes than white households, data for this area reveals a different pattern, with white residents earning significantly more than Asian residents per capita ($102,500 vs. $33,900). Still, despite high poverty among its foreign-born population, this community exhibits over twice the economic connectedness score of prosperous Hialeah, one of Florida's immigrant hubs. In large part, this is likely because high earners are simply so pervasive in this dense urban area. Cross-class ties are strong in spite of entrenched racial income divides that, in other contexts, inhibit such bridging.

Chinatown, San Francisco
Washington, DC: the positive effects of Black prosperity on economic connections
In contrast to most other American cities, all four of the nation's capital's majority Black distressed and at risk zip codes score highly on economic connectedness. The average EC value across these four zip codes is .94, with the Langdon neighborhood (20018) having the highest value of .99. In contrast, neighboring Baltimore's 11 majority Black distressed or at risk zip codes have an average EC value of .72.
One possible explanation for the unexpected strength of economic connections among low-income residents of DC's distressed zip codes could be their proximity to Prince George's County, MD, one of the few prosperous majority Black counties in the United States. It leads the country in the number of Black households with incomes surpassing $100,000. Separated by the Anacostia River from other DC neighborhoods, the District's predominantly Black distressed zip codes may have strong social and economic ties over the county boundary instead. Friendships that bridge multiple divides (e.g., race and class) are rare in the United States.[7] Consequently, a shared racial identity could facilitate economic connections between these distressed and prosperous communities. However, it is important to acknowledge that other factors, such as individual agency, geographic proximity, and existing social structures, also significantly shape economic opportunities and outcomes.
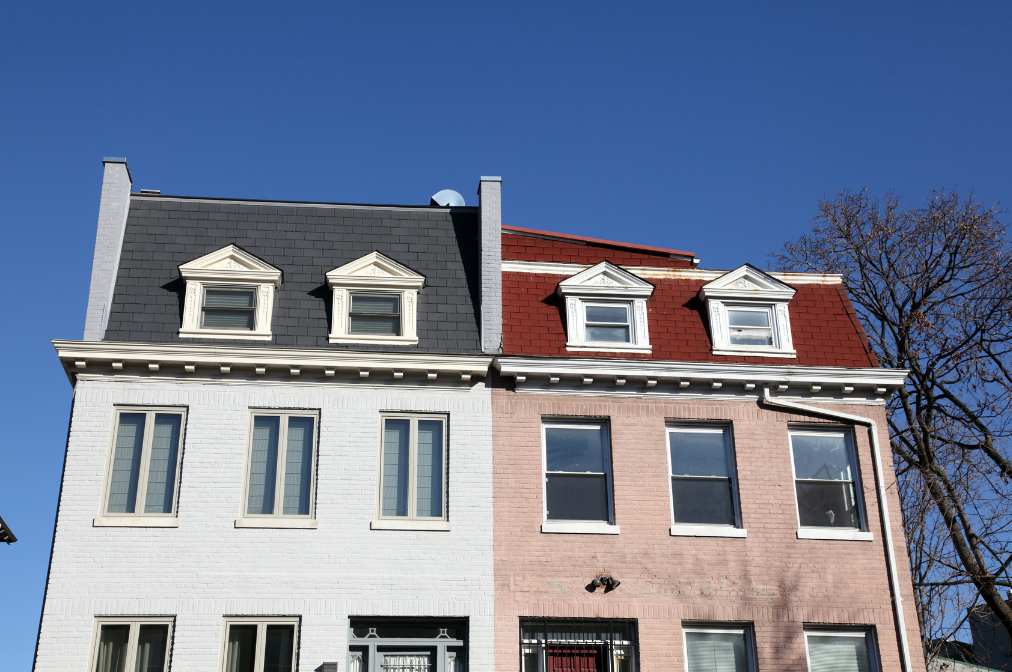
Housing in Washington, DC, near the border with Prince George County, MD
New Orleans: Building social capital in the wake of a natural disaster
Hurricane Katrina's impact on New Orleans wasn't solely natural; it was shaped by the city's socioeconomic landscape. Pre-existing vulnerabilities in impoverished communities amplified the disaster's destructive force. Political ineptitude and indifference contributed to the poor maintenance of levees and a bumbling response to the disaster.[8] Katrina also demonstrated how vital bonding and bridging social capital are when resources and support are desperately needed. The tendency for residents of distressed communities to be isolated and lack strong connections to neighbors and the broader social fabric exacerbates the impact of tragedies like Katrina.
Based on the hardship New Orleans' low-income residents suffered due to the hurricane, it is surprising that many of the city's distressed zip codes have high EC values relative to their counterparts in other cities. The Lower Ninth Ward (70117), a community devastated by the catastrophic failure of the levees during Katrina, has an EC value of .82, well above the average for distressed zip codes. That number climbs to .9 in the neighboring zip code 70116, which is also distressed with a large share of Black residents. Other distressed Black neighborhoods scattered throughout the city have high EC values as well.
Katrina's impact on social capital was multifaceted. While the disaster disrupted existing networks and caused widespread displacement, it also catalyzed new connections. Some residents tapped into aid from local and national organizations, forged new bonds with displaced neighbors, and leveraged existing connections for survival.[9] These developments may explain the high levels of bridging social capital, but the picture remains complex, especially without pre-Katrina data. It's plausible that low-income residents with weaker social networks were disproportionately displaced. The trauma of displacement, the dissolution of familiar communities, and the formation of new, geographically dispersed networks all reshaped the social capital landscape.
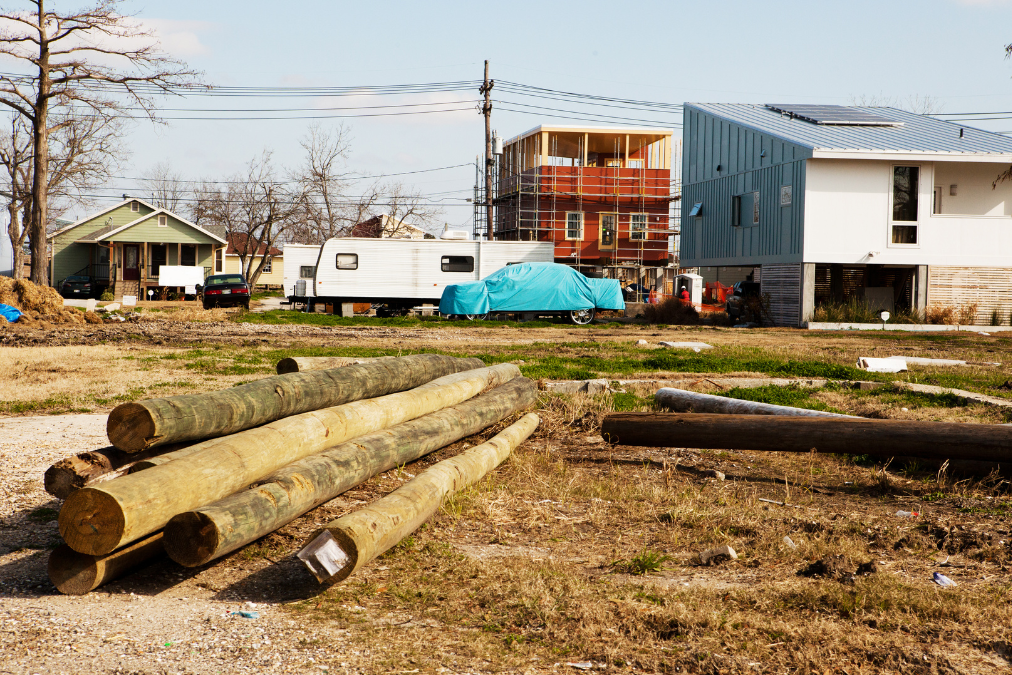
New housing being built in New Orleans' Ninth Ward
Conclusion
This analysis uncovers a stark truth about the American landscape: race, economic distress, and a lack of economic connectivity are intricately intertwined. Geographic and social segregation born from class, race, and ethnicity often serve to wall off distressed communities, significantly limiting their residents' opportunities to forge cross-class friendships.
While the link between strong cross-class connections and upward mobility is well-established, the relationship with broader community prosperity is complex. Prosperous communities typically boast robust bridging social capital, but whether this is a primary driver or a symptom of success remains unclear. Distressed communities with strong economic connections, like those in Washington, DC, and New Orleans, remain deeply impoverished despite higher upward mobility for individual residents.
The Distressed Communities Index is a powerful tool for understanding how and why the map of social capital varies and the impact that variation has on individuals and communities. By presenting these findings, we encourage further investigation into both the exceptions and the patterns that shape the nation's social and economic geography.
Notes
- Chetty, R. et al. Social capital I: measurement and associations with economic mobility. Nature https://doi.org/10.1038/s41586-022-04996-4 (2022).[↩]
- ibid.[↩]
- The Opportunity Insights researchers quantify what they label socioeconomic status primarily using household income data. Low socioeconomic status refers to individuals in the bottom half of the distribution, while high socioeconomic status refers to individuals in the upper half of the distribution.[↩]
- https://www.jec.senate.gov/public/index.cfm/republicans/socialcapitalproject[↩]
- https://assets.cambridge.org/97805218/75516/excerpt/9780521875516_excerpt.pdf[↩]
- Tuominen, M. et al. Building social capital in a new home country. A closer look into the predictors of bonding and bridging relationships of migrant populations at different education levels. Migration Studies. https://doi.org/10.1093/migration/mnad022 (2023).[↩]
- de Souza Briggs, X. Bridging networks, social capital, and racial segregation in America. Cambridge: Harvard University, John F. Kennedy School of Government https://research.hks.harvard.edu/publications/getFile.aspx?Id=35 (2003).[↩]
- Park, Y., & Miller, J. The social ecology of Hurricane Katrina: Re-writing the discourse of "natural" disasters. Smith College Studies in Social Work https://psycnet.apa.org/doi/10.1300/J497v76n03_02 (2006).[↩]
- Harkins, R. and Maurer, K.. Bonding, Bridging and Linking: How Social Capital Operated in New Orleans Following Hurricane Katrina. British Journal of Social Work. https://doi.org/10.1093/bjsw/bcp087 (2010) [↩]