The SBA has released data on the first tranche of loans awarded through the Paycheck Protection Program (PPP), the flagship support program established by Congress to help small businesses during the current economic crisis, covering the period from the program’s launch on April 3 through April 16, when the initial allocation of $349 billion was depleted. The charts below combine SBA’s PPP data with the Census Bureau’s Statistics of U.S. Businesses data (SUSB) for a more detailed look at the distribution of loans across industries and states. The most recent SUSB data cover 2017 and were released in March 2020. SUSB only captures employer businesses, while several additional categories of nonemployer businesses were available for PPP funding as well. Despite this discrepancy, SUSB provides a baseline for comparing the distribution of PPP loans across states and industries.
The comparison shows that many rural states appeared to have received a disproportionate amount of funds, and that awards only modestly targeted the industries most directly affected by the economic fallout from the COVID-19 pandemic. As the second tranche of PPP funding makes its way into the economy, this data will provide important points of comparison to evaluate whether targeting has improved over time.
Chart 1 displays each state’s share of total U.S. PPP dollars awarded compared to each state’s share of total U.S. small employer business payroll. The top five states awarded the most PPP funds are California, Texas, New York, Florida, and Illinois (the five most populous states). However, the top five states with the highest ratio of PPP funds approved relative to total small employer business payroll are Mississippi, Nebraska, North Dakota, Kansas, and South Dakota. By contrast, Missouri, DC, California, New York, and Nevada have seen the fewest PPP dollars approved relative to the size of their total small employer business payrolls. California, for example, accounts for 14 percent of the country’s small employer business payroll but has been awarded only 10 percent of PPP dollars.
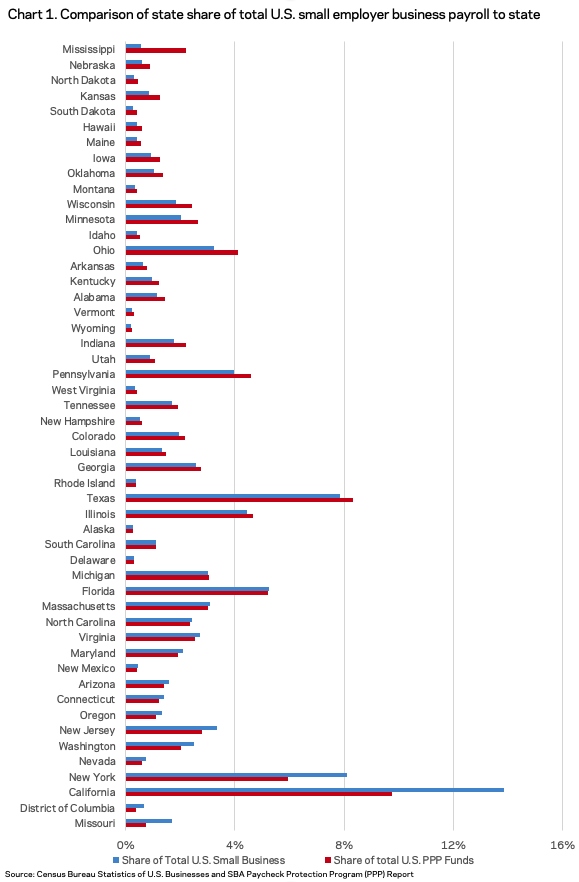
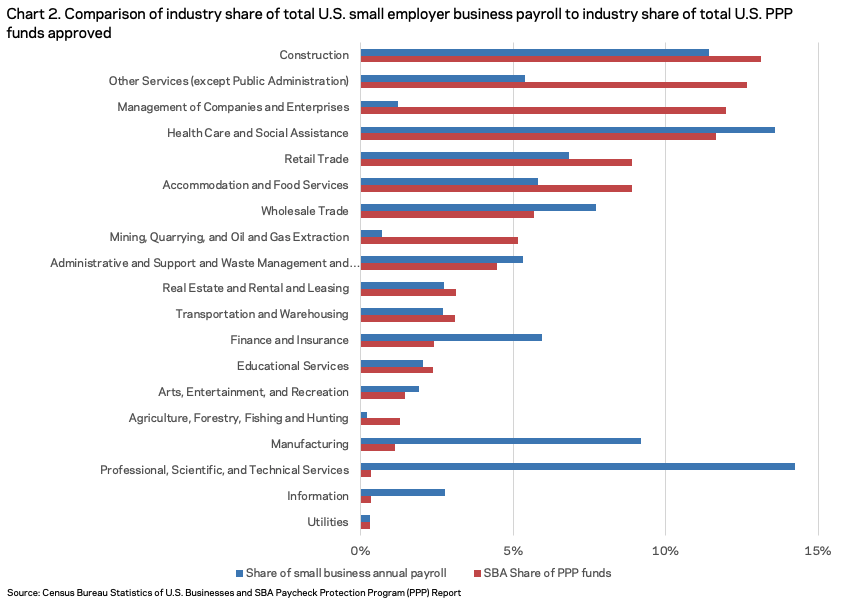
Chart 2 compares each industry’s share of total PPP dollars to each industry’s share of total U.S. small employer business payroll. The two industries receiving the most absolute PPP funding are construction and other services, the latter of which includes laundromats, hairdressers, personal care providers, repair workers, and others. Management of companies and enterprises, which in this context may represent holding companies of businesses in other industries, and mining, quarrying, and oil and gas extraction have had a relatively large amount of PPP funds approved compared to their shares of small employer business annual payroll. Manufacturing; information; and professional, scientific, and technical services have all seen few PPP dollars relative to their total small employer business payrolls. In addition to other services, retail and accommodation and food services have received relatively high levels of funding, which may reflect the fact that local shutdowns have disproportionately affected those industries. The arts, entertainment, and recreation industry, which has also been hit hard by shutdowns, has received proportionally less funding than many others.
Dollars are only one way to look at the distribution of loans, each of which varies in size. Total loan counts across states provide a different view of PPP uptake and allows us to examine how many businesses are actually taking advantage of the program. The states with the highest number of approved PPP loans are Texas, California, Florida, New York, and Illinois (again, the most populous). However, compared to the number of small employer businesses in each state, companies in California, Nevada, New Jersey, New York, and Arizona have been awarded relatively few PPP loans. The states with the highest relative numbers of PPP loans are North Dakota, Nebraska, South Dakota, Oklahoma, and Mississippi. The gaps are immense: In North Dakota, it appears that the equivalent of 58 percent of all small employer businesses have participated in the program; in California, only 15 percent. The North Dakota figures could potentially be inflated by a relatively large share of sole proprietorships taking advantage of the program, since SUSB data do not exactly capture the same universe of businesses eligible for PPP—although with the limited data provided from SBA thus far, we just don’t know—but the suggestive comparison points to extreme geographic disparities.
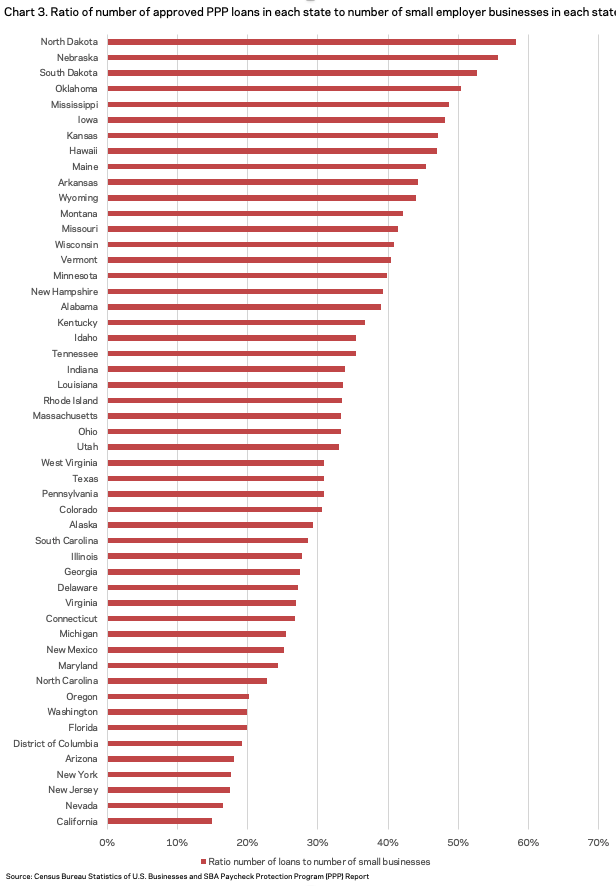
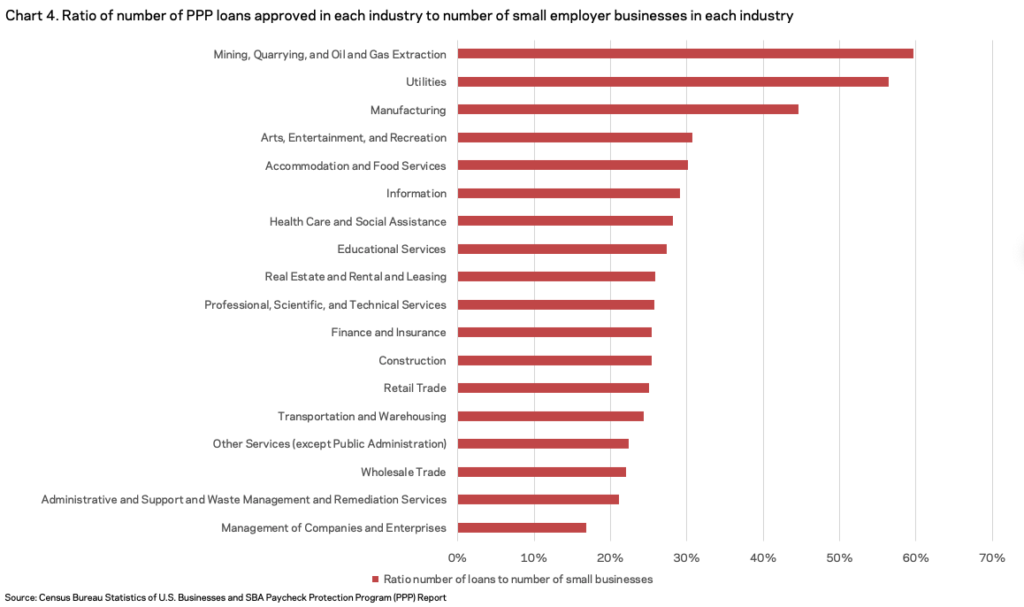
Chart 4 presents the number of PPP loans awarded relative to the total number of small employer businesses in each industry (omitting agriculture, an industry which reports over 200 percent more PPP loans than it does small employer businesses, which may be due to the large number of sole proprietorships not captured in SUSB in the industry). In addition to mining and oil and gas extraction (perhaps the industries that accounted for Texas’ outsized participation in the program relative to other big states), relatively large shares of firms in the hard-hit manufacturing; arts, entertainment, and recreation; and accommodation and food services industries appear to have taken advantage of the program. Even though the construction industry accounts for an outsized share of dollars, it seems that only a small fraction of the many small employer businesses in the industry have participated in the program. Retail, for its part, stands out among industries most directly affected by stay-at-home orders with a comparatively few awards, given its size.
These figures provide only a superficial assessment of the distribution of PPP financing. Far more data is required to rigorously evaluate the effectiveness of the program, which has several structural flaws. While some industries and states may appear to be receiving disproportionate shares of PPP funding, many forces driving PPP flows are not apparent in available data. Lenders themselves are a key variable, for example, and the swiftness with which they facilitated access to scarce program resources for their clients varies significantly across the country. In many rural states, a deep agricultural finance ecosystem may have given many businesses and proprietorships a leg up. Elsewhere, few, large loans may skew first impressions of the true reach of the program within industries or places. Additional information from SBA on borrowers (owner demographics, for example), lenders, and loan amounts would make PPP’s targeting more clear.
Given the design of the program, we may never know how many awards were granted to opportunistic applicants versus companies that truly required the lifeline to survive. That makes it all the more important to obtain the statistics that are available in order to evaluate the effectiveness of this particular policy response at a critical moment for U.S. small businesses. The insights provided here suggest modest targeting of the most truly jeopardized sectors, strong participation in rural states, and significant under-resourcing of many populous states and those on the front lines of the crisis (New York) or its economic fallout (Nevada).