by Eric Carlson
My grandmother worked as a librarian in Wisconsin Rapids, a mill city built along the banks of the Wisconsin River. She curated the collection of children’s books but, more often than not, she was preoccupied with the chore of maintaining the library’s card catalog. [1] Every few weeks, a new shipment of books would arrive in stacks piled as high as her chin and she would leaf through each volume until the perfect call number presented itself (it was never the one the publishers recommended). Once the call numbers had been assembled into a heap of index cards, she would march off to a filing cabinet where she set each card in its place. [2] The job was slow, and, at the time, there were no machines to do this work. Of course, she was happy to do it—my grandmother was a very serious person and making sure that any child could find any book was a very serious business.
She retired years before libraries across the US would start automating the maintenance of their card catalogs. But when computerization did hit libraries in the 1980s, it was a welcome change. In the autumn of 1984, librarians at the Health Sciences Library of the University of Maryland at Baltimore tied cards from the card catalog to string at the ends of red and blue helium balloons which they released in unison, a metaphorical letting go of the mundane, routine task that took too much of their time. [3]
In contrast, automation in manufacturing was met with resistance. In the 1970s in Youngstown, Ohio, 700 miles away from my grandmother’s library, General Motors was fitting their factory with industrial welding robots called “unimates.” In Studs Terkel’s Working, an oral history of work in the US, Gary Bryner, a GM auto worker, describes working with his mechanical colleagues as something almost out of Vonnegut’s Player Piano. “It looks just like a praying mantis. It goes from spot to spot to spot. It releases that thing and it jumps back into position, ready for the next car…They never tire, they never sweat, they never complain, they never miss work.”
These welding robots nearly doubled the plant’s production but reduced the need for manpower. “When they took the unimates on, we were building sixty [cars] an hour,” Said Bryner. “When we came back to work, with the unimates, we were building a hundred cars an hour. They do the work of about two hundred men—so there was a reduction of men.”
Today, the release of large language models like ChatGPT have renewed worries about automation and have ignited fears about the hostile takeover of artificial intelligence. These platforms have advanced far beyond rote data storage tasks and can even pass the bar exam. This has led white-collar workers to wonder if their jobs are soon to go not the way of the librarian, but of the factory worker.
The first in a series about the economics of automation, this essay focuses on work and what the data can and cannot tell us about our future. It will demonstrate three things. First, automation is hard to predict. Second, labor market adjustments to automation have been slow, mainly taking place over generations rather than within individual careers. Third, given the uneven geographic distribution of industries and occupations and the regional nature of labor markets, one’s experience with automation depends a great deal on where one lives. Finally, I argue that policies designed for the future of work should not try to inhibit technological change; rather, we need place-based policies that focus on helping workers transition from one job to the next.
A Data-Centric Approach to Automation and Jobs
The U.S. Department of Labor keeps a record of how Americans work, among other labor market statistics. This information is collected and stored in an online database called the Occupational Information Network (O*NET for short), which is an update to the Dictionary of Occupational Titles (DOT). O*NET has detailed information about the task content and working conditions of roughly 1,000 occupations. Among other things, these data show us how exposed workers are to automation: O*NET asks respondents “How automated is your current job?” with answers ranging on a scale from one (“Not at all automated”) to five (“Completely automated”).
The box-and-whisker plot in Figure 1 shows the distribution of automation scores for occupations grouped by their two-digit Standard Occupational Classification (SOC) codes. The vertical lines at the center of each box provide a measure of the average exposure to automation within each occupation group. The width of each box shows the range of automation exposure for a typical worker while the whiskers extending in either direction from the boxes’ edges provide a visual representation of the extreme values of exposure to automation. [4]
Perhaps surprisingly, exposure to automation does not easily align with simple blue-collar and white-collar distinctions: many white-collar jobs are highly exposed to automation and many blue-collar jobs are hardly exposed at all. The three occupation groups that cite the highest degree of automation are office and administrative support; production; and business and financial operations occupations. The three occupation categories that cite the least exposure to automation are personal care and services; installation, maintenance and repair; and educational instruction and library occupations. [5]
The data also show that workers in related occupations can have very different experiences with automation. For example, some production workers are very exposed to automation while others are not. At one end of the spectrum, turning machine tool operators (SOC 51-4034) who use heavy machinery to strip metal from the surfaces of rotating workpieces are already being automated out of the job. On the other hand, custom tailors (SOC 51-6052), who work directly with clients to fix or fashion sometimes intricate garments, report a relatively low degree of automation.
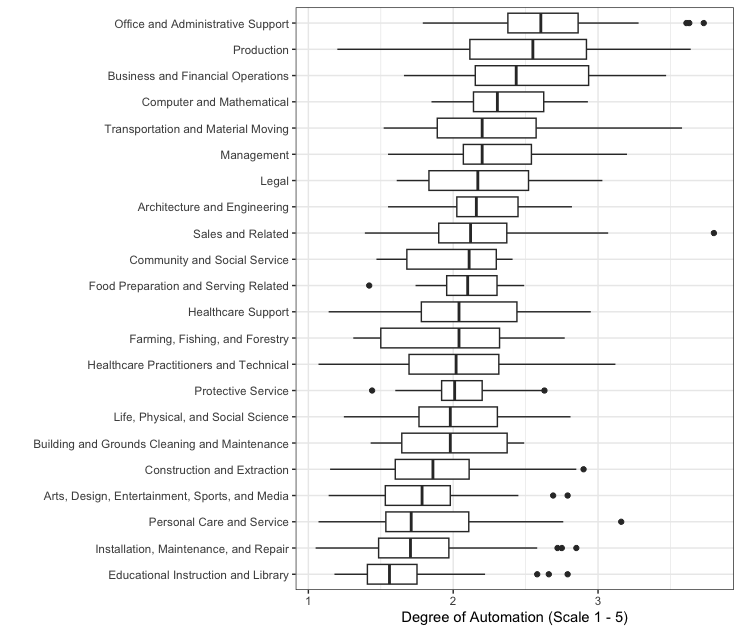
Figure 1. Automation affects both blue- and white-collar jobs
Source: Author’s calculations using 2019 O*NET data
These differences in exposure to automation can partly be explained by differences in individual job characteristics. In 2003, economists David Autor, Frank Levy, and Richard Murnane described automation as a form of capital that can perform routine tasks—tasks with simple rules that are done over and over again—but cannot perform non-routine tasks—tasks that require abstract judgment and decision making. [6] In other words, they argue that unmanned machines, at least from the viewpoint of 2003, are good at repetitive jobs with straightforward instructions. Compared to other workers, people in jobs like these face greater risk of automation-induced displacement.
Supporting this framework, Figure 2 shows that occupations involving more repetitive tasks are more likely to be exposed to automation than less repetitive jobs. For example, payroll clerks (SOC 43-3051), who maintain records of employee work data, report both high degrees of repetition on the job as well as high degrees of exposure to automation. In contrast, mediators (SOC 23-1022), who negotiate complicated legal disputes, experience neither high degrees of repetition nor high degrees of automation. However, the correlation between current degrees of repetition and current degrees of automation does not tell us whether machines replace people or if machines work with people to make them more productive.
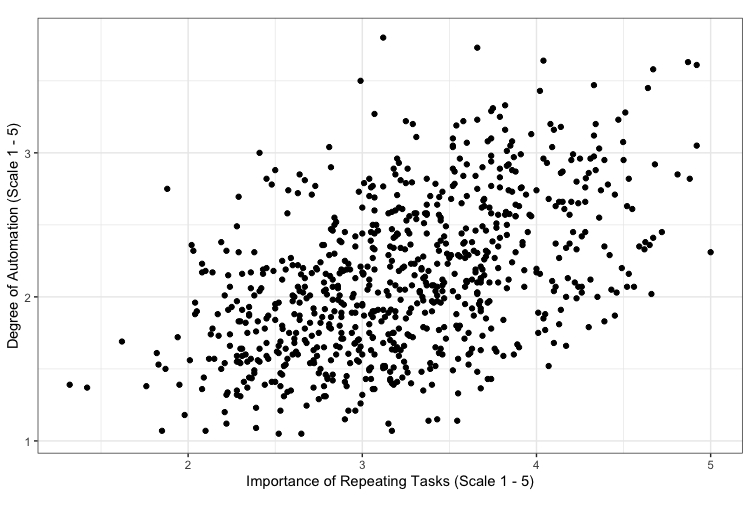 Figure 2. Repetitive jobs are more exposed to automation
Source: 2019 O*NET data
Other correlations complicate the idea that automation serves purely to replace labor. For example, there is almost no relationship between the freedom to make decisions on the job and an occupation’s observed degree of automation. As shown in panel (a) of Figure 3, some occupations that involve a great deal of decision making are highly exposed to automation while some occupations that involve fewer decisions have very little exposure. One possible explanation is that in some decision-heavy occupations, machines handle the routine elements of the job, freeing workers to focus on more abstract tasks.
To see how technology has the potential to both displace some workers and make others more productive, consider, for example, a comparison between telephone operators and airline pilots. Despite the fact that both are highly exposed to automation, many telephone operating jobs are already being done by machines while piloting planes, on the other hand, will likely continue to be done by humans. As shown in panel (b) of Figure 3, these differences in experience are likely due to their very different degrees of decision making freedom.
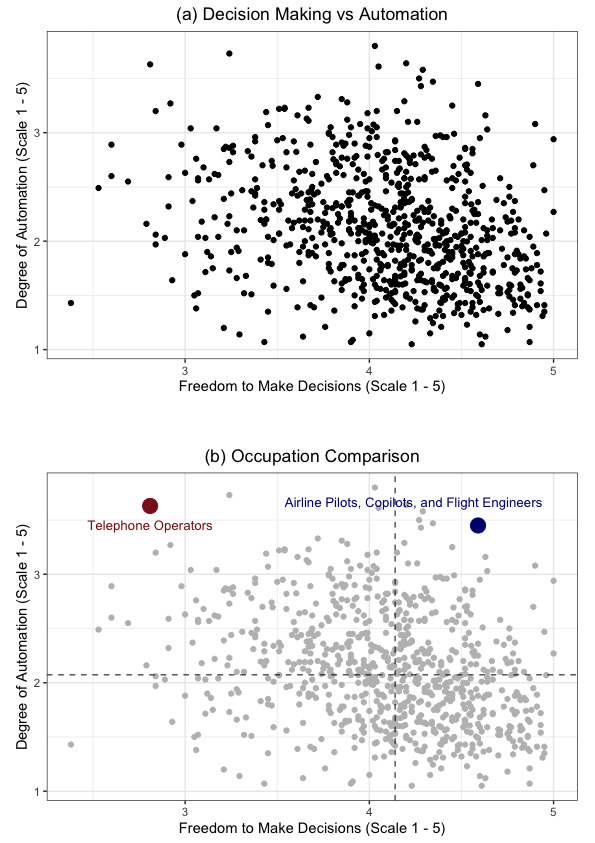
Figure 3. Automation is not related to the freedom to make decisions
Source: 2019 O*NET data
Compared to most other occupations, telephone operators have little freedom to make decisions. In Working, Terkel speaks with Sharon Griggins (under the pseudonym Heather Lamb), who worked as a telephone operator in Illinois in 1972. She describes her job as repetitive and narrow in scope. Griggins tells Terkel, “There are about seven or eight phrases that you use and that’s it: ‘Good morning, may I help you?’ ‘Operator, may I help you?’…That’s all you can say.” In the original audio recording, not included in the book, she laments, “You get to feel just like a machine.”
On the other hand, pilots are required to make a large number of decisions and respond quickly to changes in the wind and weather. While some tasks involved in flying airplanes have already become automated, robots tend to take the form of assistants rather than replacements. In addition, safety concerns make it unlikely that pilots will be replaced by robots. [7]
While these data offer a glimpse of how automation interacts with work, they only provide a snapshot of occupational automation exposure at a point in time. But fears about automation center on the future of work and not necessarily on working life as it currently stands. Unfortunately, despite efforts to predict the impact of automation on different jobs, the data show that automation has been hard to anticipate.
The Uncertain Future of Automation
O*NET has recorded, and periodically updated, its measure of automation since the early 2000s, giving us almost two decades worth of data about how jobs have changed. That data show that, in general, jobs have not all become more automated over time. While some jobs have become more automated, others have become less so. Panel (a) of Figure 4 shows the distribution of occupation-level changes in the degree of automation between 2002 and 2019. The distribution is centered around zero—many tasks that could not be automated in 2002 still could not be automated in 2019—but there is a great deal of dispersion.
Curiously, changes in exposure to automation do not easily align with blue-collar and white-collar boundaries. Some blue-collar occupations reported high degrees of automation in 2002 and lower degrees of automation in 2019 and some white-collar occupations reported low degrees of automation in 2002 but high degrees of automation in 2019. For example, railroad brake, signal, and switch operators reported a high degree of automation in 2002 but a low degree of automation in 2019. In contrast, claims examiners, travel agents, and insurance appraisers all demonstrated a marked increase in automation exposure over this time period.
The scatterplot in panel (b) of Figure 4 further demonstrates the weak correspondence between the 2002 and 2019 measures of automation. The dashed diagonal line represents points at which the 2002 measure exactly predicted the 2019 measure. Dots to the left of the line show instances where the 2002 measure underpredicts future automation exposure and dots to the right of the line show instances where the 2002 measure overpredicts future automation exposure. Confirming the data in the histogram, the 2002 measure underpredicts roughly half of all occupations in the database and over predicts the other half. In other words, there is not a strong systematic relationship between the past and present (self-reported) measures of automation.
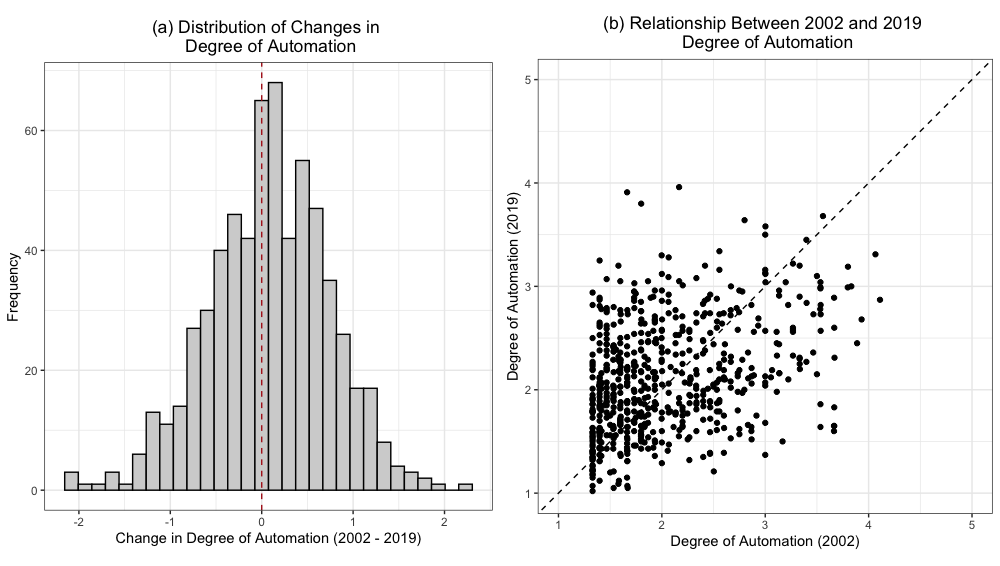
Figure 4. Past automation exposure does not predict future automation exposure
Source: 2002 and 2019 O*NET data
In addition, experts have tried to predict the probability of automation for different occupations using textual descriptions of different jobs. These predictions show only a weak relationship with the observed exposure to automation as measured through the O*NET questionnaire. For example, in a 2017 paper by Frey and Osborne, the authors use textual descriptions of occupations to classify jobs by their probability of becoming automated. [8] The authors use information about the sets of knowledge, skills, and tasks needed for each occupation and use a machine learning classification algorithm to assign automation probabilities to each job. Importantly, Frey and Osborne (2017) extend the conceptualization of automation and work by stressing that advances in artificial intelligence imply that office jobs can be as susceptible to automation as production jobs.
While the analysis in Frey and Osborne (2017) made an important contribution to our understanding of automation, Figure 5 shows how much these predictions diverge from reality. The horizontal axis shows each occupation’s O*NET measure of observed automation exposure and the vertical axis shows each occupation’s probability of automation baked on Frey and Osborne’s methodology. The data exhibit a number of notable features. First, there is a very weak relationship between expert prediction and observed exposure to automation. For example, many jobs that demonstrate a high level of exposure to automation were classified as having a low automation probability. Second, most of the values from the expert prediction are clustered around zero and one. In other words, the algorithm creates a stark contrast between safe and susceptible occupations. This method follows earlier approaches that have employed written occupational descriptions to divide jobs into automatable or not, when the reality is much more nuanced.
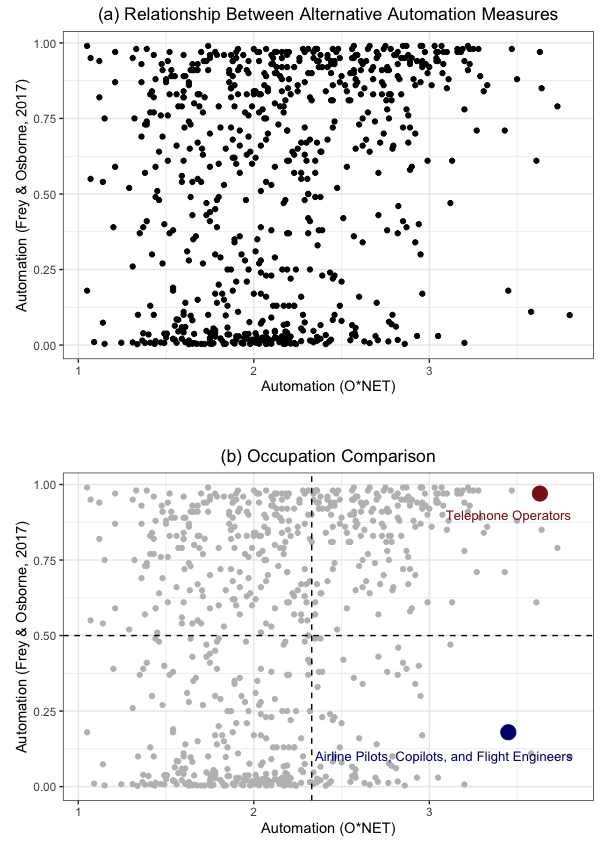
Figure 5. Weak correlation between expert prediction and observed automation exposure
Source: Frey and Osborne (2017) and 2019 O*NET data
Looking at specific jobs shows that the classification method is perhaps more concerned with the complete replacement of humans by machines than with the general introduction of automated capital into each occupation’s workflow. For example, we can again compare telephone operators with airline pilots. Unlike airline pilots, telephone operators are both highly exposed to automation and are also at great risk of replacement by machines. Panel (b) of Figure 5 shows that the Frey and Osborne (2017) algorithm assigns a high automation probability to telephone operators and a low probability to airline pilots. But because O*NET measures the realized exposure to automation and Frey and Osborne (2017) focus on replaceability, we can jointly use these measures to classify occupations according to their exposure to labor-substituting or labor-complementing automation.
Occupations that lie in the upper right-hand quadrant of the figure, like telephone operators, can be classified as being exposed to labor-substituting automation. These are occupations that have a high predicted probability of machine replacement and a high observed exposure to automation. Many of these occupations are white-collar office jobs. For example, tax preparers, loan officers, and insurance underwriters all fall under this category. Based on employment data from the Current Population Survey (CPS), this group accounted for around 17 percent of total employment in the United States in 2019.
On the other hand, occupations that lie in the bottom right-hand quadrant of the figure can be classified as being exposed to labor-complementing automation. In contrast to jobs exposed to labor-substituting automation, these occupations have a low predicted probability of replacement by machines but high observed exposure to automation. These include a diverse group of occupations ranging from the sciences to healthcare to management. For example, biochemists, respiratory therapists, and industrial production managers all report a high use of automated technology but have a low displacement score according to the Frey and Osborne (2017) methodology. In 2019, this category accounted for about 10 percent of total employment nationally.
Automation’s relationship to how we work is complex and multifaceted. In some cases, machines can replace workers while in other cases, machines make workers more efficient. This technological diversity has made automation difficult to predict. But a careful combination of observational data and expert prediction can offer better insights into how automation affects workers. The distinction between labor-substituting and labor-augmenting automation has consequences for how people have made labor market decisions over time.
Automation and Evolving Patterns of Employment
In 2022, the New York Times spoke with Paul Rizzo, a man in his late 30s without a four-year college degree who lost his job to automation. After a long period of unemployment, he found work as a delivery driver on the DoorDash app, reflecting a larger trend in the labor market in which automation has led the service sector to replace the manufacturing sector as a major employer of non college-educated labor. [9] This transition can be difficult and, as the Times points out, painfully slow for many workers, often involving long spells out of the labor force.
Data from the CPS confirm that automation is reshaping the labor market at a steady pace. We can see some of this change in the steadily declining share of employment in occupations exposed to labor-substituting automation. As shown in Figure 6, from 1990 to 2019, the percentage of workers in jobs that can be done by machines, as defined by the lower right quadrant of Figure 5, has been decreasing while the percentage of workers in jobs that machines can complement, as defined by the upper right quadrant of Figure 5, has been slowly increasing. In 1990, about 22 percent of American workers were employed in a job exposed to labor-saving automation. By 2019, this number had fallen to just under 17 percent. In contrast, in 1990, about 8 percent of Americans were employed in an occupation that was exposed to labor-augmenting automation. By 2019, this number had grown to slightly over 10 percent—a 25 percent increase. Given the scale of the U.S. economy, these changes are substantial and represent millions of workers. These changes are not only driven by incumbent workers switching jobs but also by new workers choosing occupations that are less exposed to labor-substituting automation.
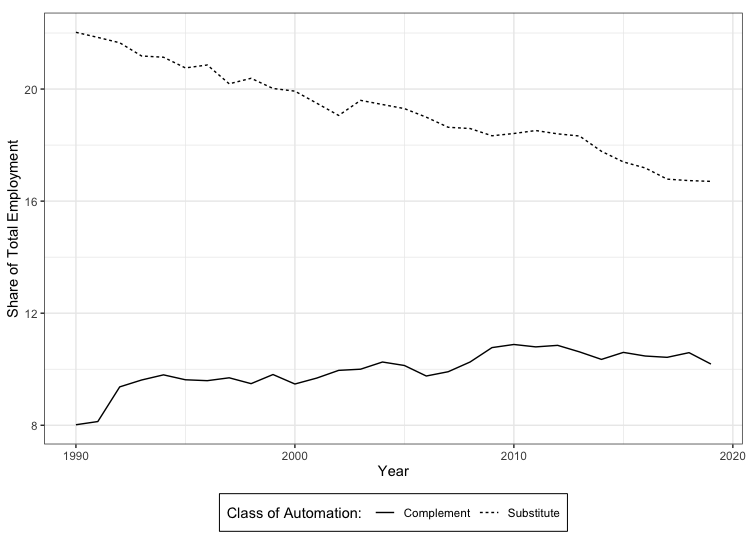
Figure 6. Workers have been leaving substitutable jobs
Source: Author’s calculations using data from Frey and Osborne (2017), O*NET, and the Current Population Survey
Labor market transitions can be difficult. Experienced workers develop specialized skills that are hard to transfer to new settings. For example, after workers lost manufacturing jobs to Chinese import competition in the early 2000s, many low-wage workers hopped from production job to production job, often accepting a pay cut to do so, rather than find a new profession despite the industry decline. [10] In contrast, many high-wage workers managed to transition into other high-paying jobs outside of manufacturing. These workers who were able to transition out of manufacturing suffered no earnings losses relative to their peers in industries that were less exposed to Chinese import competition. Much of the economic damage to workers, therefore, came from the inability to transition to new industries rather than from the direct effect of declining manufacturing wages.
Because occupational transitions are difficult over the course of a career, the largest movements out of automatable jobs have come from new labor market entrants rather than incumbents. In general, people enter lower-skilled occupations early in their careers and gradually transition into higher-skilled occupations as they get older and gain experience. Figure 7 shows that each new generation of worker has been less likely to enter occupations that can be substituted by labor-saving technology than the generation before, as seen in panel (a). But transitions out of these jobs over the course of a typical career has been steady across generations.
The solid line represents the decisions of workers born between 1965 and 1974, the dashed line represents the decisions of workers born between 1975 and 1984, and the long-dashed line represents the decisions of workers born between 1985 and 1994. With every generation, a smaller share have entered occupations that can be done by machines. Roughly 27 percent of people born between 1965 and 1974 entered occupations exposed to labor-substituting technology in their early 20s compared to roughly 21 percent of their counterparts born between 1985 and 1994. However, once younger generations of workers have entered automatable occupations, their transitions out of those jobs mimics the transitions of older generations. In each cohort, roughly 5 percent of workers move out of occupations exposed to labor-substituting technology every 10 years.
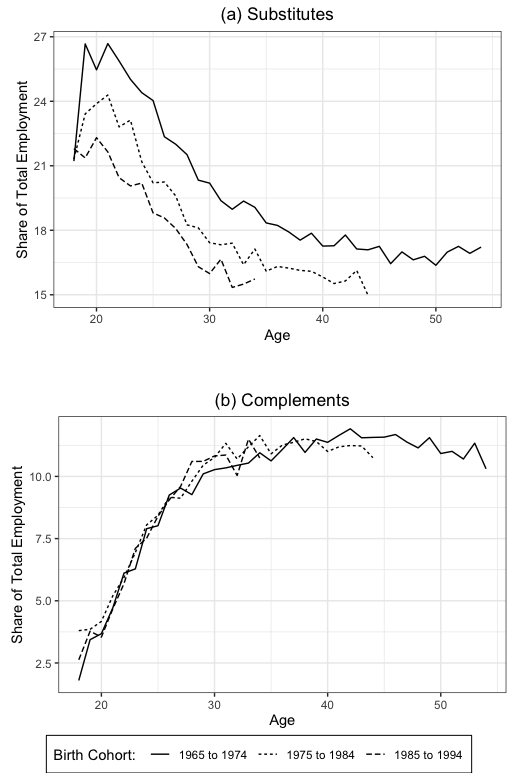
Figure 7. Each new generation is less likely to enter automatable jobs
Source: Author’s calculations using data from Frey and Osborne (2017), O*NET, and the Current Population Survey
As shown in panel (b), there has been little generational change in the share of workers entering jobs that are exposed to labor-augmenting automation. Instead, much of the changing labor market choices across generations has involved selection into non automation-exposed occupations. The reasons behind these generational shifts remain unclear. However, one possibility is that occupations that use labor-augmenting technologies require initial investments in training or human capital that are not available to the types of workers who would have otherwise taken jobs that now use labor-saving machines.
Automation has changed the structure and composition of the labor market. Every year workers have moved away from occupations that are exposed to labor-saving technology. However, this adjustment is slow and takes place over generations. Other research has shown that transitions remain difficult for existing members of the labor force because, over the course of a career, workers make industry- and occupation-specific human capital investments that are not portable. [11, 12] In addition, many workers in automation-exposed occupations may live in regions of the country where most other jobs are also highly-exposed to automation. These factors, along with declining geographic mobility, suggest that occupational choices may be more restricted than aggregated nation-wide data would imply. [13]
Geography of Automation Exposure
Automation affects all corners of the United States. Across commuting zones, between 24 and 36 percent of all workers are exposed to automation. Nevertheless, that range does leave some places significantly more exposed than others. Given the regional nature of both industries and labor markets, policymakers must understand automation through a geographic lens. Consider a worker who loses her job to a machine. If most of the other related firms in her labor market are also shedding workers due to automation, her ability to recover from her job loss is severely limited. On the other hand, if she lived in a part of the country with a more diverse mix of occupations, she could transition to a new job more easily.
Indeed, the average exposure to automation varies widely across the United States. [14] Figure 8 shows a map of the share of workers in highly automation-exposed occupations based on automation data from O*NET and employment data from the 2019 American Community Survey (ACS). [15] Each boundary on the map represents a local labor market called a commuting zone which is a collection of counties that exhibit a great deal of commuting within zones and little commuting between zones. [16]
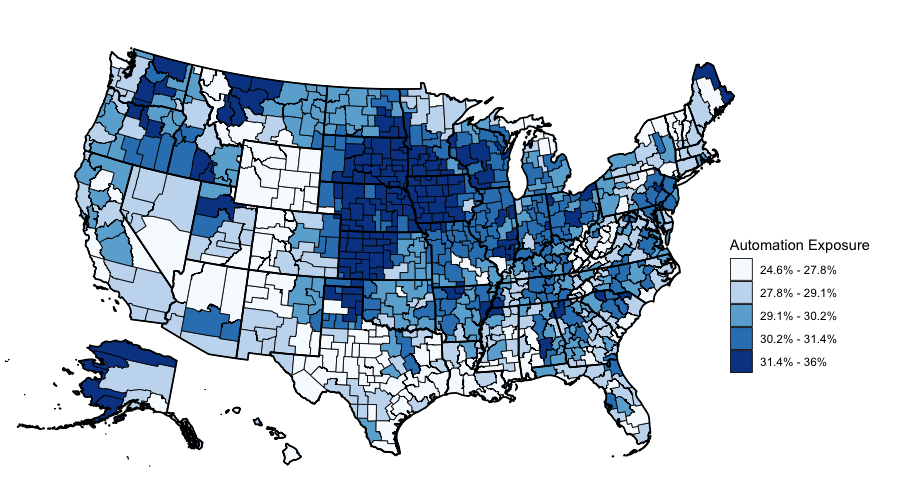
Figure 8: The Great Lakes region is highly exposed to automation
Source: Author’s calculations using data from the 2019 American Community Survey and 2019 O*NET data
Exposure to automation varies across regions and is neither extremely concentrated nor widely dispersed. For example, in contrast to the strong local clustering exhibited by the U.S. manufacturing sector, exposure to automation spans a wider range of geographic regions. However, exposure to automation is more concentrated than the fairly evenly-distributed healthcare sector. Thus, while macroeconomic policies that promote full employment can help workers who are affected by automation, targeted place-based policies are still needed to address specific regional challenges.
Figure 9 compares the distributions of exposure to automation, exposure to manufacturing in 1990, and exposure to the healthcare sector. In order to focus on distributional comparisons, each measure is centered at 0. A flatter and broader distribution implies more regional specialization while a thinner and more pointed distribution implies less concentration. As shown in panel (a), exposure to automation is much less regionally concentrated than exposure to manufacturing and, as shown in panel (b), exposure to automation is slightly more regionally concentrated than exposure to the healthcare sector.
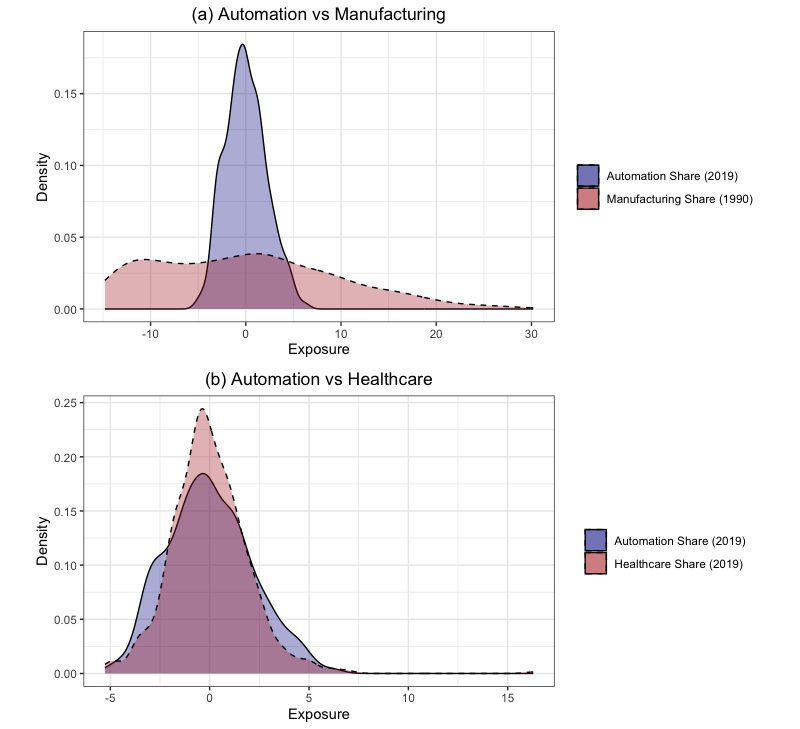
Figure 9: Automation is less regionally concentrated than manufacturing but more concentrated than healthcare
Source: Author’s calculations using data from the 1990 Decennial Census, 2019 American Community Survey, and 2019 O*NET data
The share of workers in highly automation-exposed occupations ranges from about 25 percent to 36 percent across commuting zones. This is roughly in line with other estimates of the geographic variation of exposure to automation. Low and high rates of exposure tend to be strongly clustered in space. The least-exposed commuting zones are mostly located in the Mountain West as well as coastal areas on either side of the country. In contrast, the most-exposed commuting zones tend to be located in the Great Plains and Rust Belt regions.
Labor markets in the Mountain West tend to have high shares of workers in management or in customer-facing service occupations like retail sales workers or waiters. In addition, there is also a relatively large share of workers in construction and carpentry. These jobs still require a great deal of human input either because of their service orientation, as in the case of restaurant servers, or because newer technology is not in widespread use, as in the case of construction.
Interestingly, the map of high exposure to automation is not shaped by production occupations but by jobs in agriculture. This is partly due to an increasingly automated agricultural sector and partly due to broad regional sectoral specialization. For example, over 6 percent of workers in the Ord, NE commuting zone work in agriculture management. Such jobs have become high-tech in recent years, with a lot of data collection and storage tasks that are now automated by computers. Many others in the Great Plains region work as accountants or financial managers, which are occupations with high exposure to automation, likely serving the agricultural sector as well.
While Figure 8 describes exposure to automation in a broad sense, we can further classify automation as being labor-substituting or labor-complementing. Labor-substituting automation refers to robots or software that have the capacity to replace workers. I define occupations that are exposed to labor-substituting automation based on having levels of observed automation exposure as measured by O*NET and probability of replacement as measured by Frey and Osborne (2017) above the median. These are occupations that lie in the upper right quadrant of Figure 5. Labor-complementing automation, on the other hand, refers to machines that aid workers by taking away the burden of repetitive tasks and giving the worker more time to focus on abstract tasks. I classify occupations as being exposed to labor-complementing automation if they have above median observed exposure to automation but below median probability of replacement. These are occupations that lie in the bottom right quadrant of Figure 5.
Figure 10 shows the geographic distribution of the share of workers exposed to labor-substituting automation. Nationwide, the shares range from about 13 percent to 22 percent. As before, there is a great deal of geographic clustering. High shares of labor substituting automation are concentrated in the Great Lakes region as well as the coastal areas of Alaska.
In general, high exposure to labor-substituting automation is not driven by production occupations. For example, automation in the commuting zones along Alaska’s Pacific coast comes from Alaska’s substantial commercial fishing industry. Fishing in the United States has become increasingly automated in recent years. [17] In addition, even in commuting zones with large manufacturing industries, exposure to labor-substituting automation is driven by services and clerical occupations rather than production occupations. In the commuting zone containing Flint and Detroit, for example, exposure to automation is driven by people working as secretaries, accountants, or billing clerks. Just over 17 percent of total labor hours in this commuting zone are devoted to occupations exposed to labor-saving technology. About 2 percentage points are due to production occupations while about 6 percentage points are due to administrative occupations.
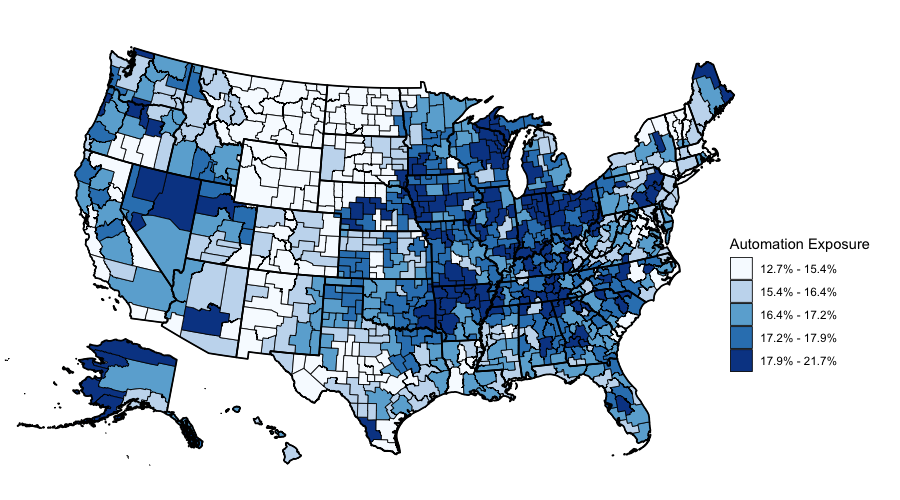
Figure 10: Labor-Saving Automation is Concentrated in the Great Lakes
Source: Author’s calculations using 2019 ACS data, 2019 O*NET data, and data from Frey and Osborne (2017)
Figure 11 shows the geographic distribution of the share of workers exposed to labor-complementing forms of automation. In general, fewer workers are exposed to labor-complementing technology than to labor-saving technology. Shares range from 6.6 percent to 17.4 percent. The majority of highly-exposed commuting zones lie in the Great Plains region.
This automation exposure is driven largely by a high-tech agriculture industry. For example, in the commuting zone containing Pierre, SD, almost 10 percent of workers are in agricultural management. According to O*NET, agricultural managers use automated software to record and collect data but must use a great deal of judgment to make decisions about how to allocate resources given the available data. In non-agricultural commuting zones, exposure to labor-augmenting automation is largely due to finance, management, and public protection. For example, in the commuting zone comprising Washington, D.C., parts of Maryland, and northern Virginia, automation exposure is driven by criminal investigators, first-line supervisors of office administrative workers, and financial managers.
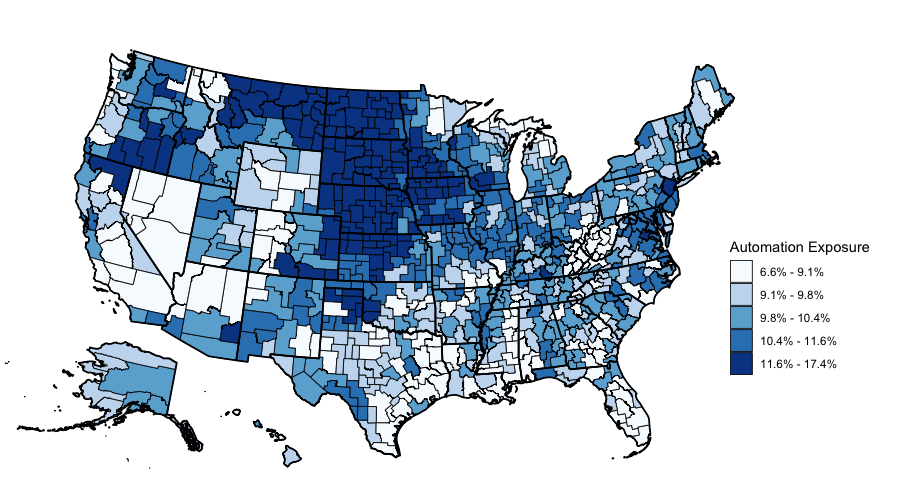
Figure 11: Labor-Complementing Automation is Concentrated in the Plains
Source: Author’s calculations using 2019 ACS data, 2019 O*NET data, and data from Frey and Osborne (2017)
Contrary to popular belief, exposure to automation is not driven by production occupations but by agriculture, finance, and clerical occupations. This pattern is true both of labor-saving technology as well as labor-augmenting technology. In addition, regional specialization in different industries generates disparate impacts of automation across local labor markets in the United States. This uneven geography of automation means that policymakers must recognize the importance of place when crafting policy proposals to facilitate labor market transitions for those exposed to or displaced by automation. [18]
Rethinking Labor Policies for the Automation Economy
As technology continues to shape our economy, policymakers find themselves grappling with the labor market effects of automation. Some, like Democratic senators Mark Warner and Chris Coons and Republican senator Mike Lee, have proposed policies that promote workforce development. Others, like Senator Bernie Sanders, have considered taxing robots to combat the displacement of workers. The evidence shown in this analysis suggests that sound labor market policy for the automation age should not focus on impeding investments in new technology. Rather, good policy should focus on enabling smooth transitions for workers from one job to the next.
Though well-intentioned, policies like robot taxes may do more harm than good because the effect of automation on job loss is often indirect. Take industrial robots as an example: Rather than lay workers off, companies that adopt robots usually expand their labor force after investing in automation. [19] Instead, job losses occur when small companies that do not adopt robots lose market share to larger firms and close or reduce their workforce. [20] In a best case scenario, robot taxes conditioned on layoffs will have no effect since firms that invest in robots tend to increase employment anyway. But if the tax is a general penalty for robot adoption of any kind, then a policy that penalizes net job creators may backfire.
This Schumpeterian “creative destruction” caused by growing and shrinking firms will require workers to move from one job to the next. But labor market transitions can be costly for individuals and the labor market in general is slow to adjust to economic transformations. As shown above, labor market shifts in the United States tend to take place over the course of generations. Each new cohort of workers makes different choices about their initial occupations but, once employed, they tend to continue with a set career path.
The expensive nature of transitions – foregone earnings from time in unemployment combined with the costs of retraining and frequency of having to “trade down” into a lower-paying role – have historically been the main source of individual economic losses from labor market changes. For example, evidence from the adjustment to Chinese import competition shows that the difficulty lay not in the decreased labor demand in manufacturing but the difficult move from manufacturing into other industries. [21] Because transitioning to new work is difficult, job losses tend to have long-run effects on workers and diminish lifetime earnings. [22]
Job transitions are even more salient in the context of automation. While trade shocks are typically one-off changes to the structure of the economy, automation is an ongoing process of technological change. As a result, the future of work is likely to be that of a labor market in flux rather than a labor market in decline.
Geographic and regional disparities also pose a key barrier to labor market adjustment. Differing initial economic conditions can make some regions less resilient than others to changes in the economy, be they import competition or new technology. [23] The regional concentration of automation-exposed jobs combined with natural geographic variation in industries and occupations means that the transition will be made more or less difficult depending on where the worker lives. Many workers are unwilling to accept jobs at a pay loss, resulting in longer spells of unemployment and lost human capital accumulation. Place-based labor market adjustment policies, especially those targeted at regions that are most distressed, are essential components of a wider policy framework that facilitates good labor market outcomes by working in the direction of technological change, rather than against it.
Conclusion
The effects of automation on the labor market are nuanced and complex. Historically, reactions to automation have varied among workers. Librarians embraced the digitization of cataloging their collections as the removal of mundane tasks freed them to do better things with their time. But production workers resisted the rise of robots for fear of losing their jobs.
Now, new technologies like large language models have skilled white-collar workers worried about their job security. Some of the fear stems from the uncertainties surrounding the unpredictable nature of automation. But a careful analysis of observational data, expert prediction, and past experience can offer insights into how automation may affect workers.
Automation has undoubtedly transformed the labor market, but adjustments occur at a slow pace. While each new generation of worker has been less likely to enter automatable jobs, transitions remain difficult for existing members of the labor force. Over the course of a career, workers make industry- and occupation-specific human capital investments that are not portable.
In addition, many workers in automation-prone occupations happen to live in parts of the country where most other jobs are also highly exposed to automation. As a result, occupational choices may be more restricted than nation-wide data would suggest. Because automation’s impact varies by region, local context matters for designing policies to adjust to technological change.
These policies should not tax or impede the adoption of new technology since hampering automation may backfire. Instead, legislation should be aimed at aiding transitions to new work. In addition, because of the regional nature of labor markets, place-based policies are crucial and targeted measures should address the needs of distressed regions. By prioritizing policies that are adaptive and region-specific, we can harness the transformative power of automation and foster a future of work that benefits all members of society.
Notes
- For readers too young to remember, libraries used to store information about their books and where to find them in enormous filing cabinets filled with loose cardstock. Each card had a different book’s call number, authorship, publishing information, and, often, a short synopsis.
- A card’s place could mean different things to different people. My grandmother organized cards alphabetically by the author’s last name. But others organized cards alphabetically by title.
- For more on the transition to digital cataloging, see Nicholson Baker’s Aril 4, 1994 article on the subject in the New Yorker
- The vertical bar in the middle of each box represents the median automation measure for an occupational category. The left-most vertical line indicates the bottom quartile while the right-most vertical line indicates the upper quartile. The horizontal lines extend to 1.5 times the interquartile range or to the extreme high and low values of the distribution, whichever comes first.
- Of this last group, librarians are the most exposed to automation.
- Autor, D. H., Levy, F., & Murnane, R. J. (2003). The skill content of recent technological change: An empirical exploration. The Quarterly journal of economics, 118(4), 1279-1333.
- In November 2022 the Federal Aviation Administration released an advisory circular stating that the responsibility of flightpath management should be with the pilot and not the automation system at all times.
- Frey, C. B., & Osborne, M. A. (2017). The future of employment: How susceptible are jobs to computerisation?. Technological forecasting and social change, 114, 254-280.
- Autor, D. H., & Dorn, D. (2013). The growth of low-skill service jobs and the polarization of the US labor market. American economic review, 103(5), 1553-1597.
- Autor, D. H., Dorn, D., & Hanson, G. H. (2016). The China shock: Learning from labor-market adjustment to large changes in trade. Annual review of economics, 8, 205-240.
- Xu, M. (2018). Understanding the decline in occupational mobility. Working Paper.
- Sullivan, P. (2010). Empirical evidence on occupation and industry specific human capital. Labour economics, 17(3), 567-580.
- Kaplan, G., & Schulhofer‐Wohl, S. (2017). Understanding the long‐run decline in interstate migration. International Economic Review, 58(1), 57-94.
- Brynjolfsson, E., Buffington, C., Goldschlag, N., Li, J. F., Miranda, J., & Seamans, R. (2023). The Characteristics and Geographic Distribution of Robot Hubs in US Manufacturing Establishments (No. w31062). National Bureau of Economic Research.
- Exposure to automation is based on the 2019 O*NET automation measure. Occupations are classified as highly automation-exposed if they lie within the top 67th percentile according to this measure. Occupation shares are based on 2019 data on employment from the American Community Survey. Employment is measured in annual labor hours.
- The map uses 1990 commuting zone boundaries
- Einarsdóttir, H., Guðmundsson, B., & Ómarsson, V. (2022). Automation in the fish industry. Animal Frontiers, 12(2), 32-39.
- Brynjolfsson, E., Buffington, C., Goldschlag, N., Li, J. F., Miranda, J., & Seamans, R. (2023). The Characteristics and Geographic Distribution of Robot Hubs in US Manufacturing Establishments (No. w31062). National Bureau of Economic Research.
- Dixon, J., Hong, B., & Wu, L. (2021). The robot revolution: Managerial and employment consequences for firms. Management Science, 67(9), 5586-5605.
- Koch, M., Manuylov, I., & Smolka, M. (2021). Robots and firms. The Economic Journal, 131(638), 2553-2584.
- Autor, D., Dorn, D., & Hanson, G. H. (2021). On the persistence of the china shock (No. w29401). National Bureau of Economic Research.
- Davis, S. J., & von Wachter, T. (2011). Recessions and the costs of job loss. Brookings Papers on Economic Activity, 1-73.
- Austin, B. A., Glaeser, E. L., & Summers, L. H. (2018). Jobs for the Heartland: Place-based policies in 21st century America (No. w24548). National Bureau of Economic Research.