


By Sarah Eckhardt and Nathan Goldschlag
Recent tremors in the labor market are being pinned on Artificial Intelligence. A cooling job market for technology workers, for example, is taken as evidence of AI-induced job loss. So is the rising unemployment rate among recent college graduates.
Is your job at risk? Well, if you are reading this, chances are you do a lot of your work on a laptop — and laptop jobs, we are told, will be the first to go.
We can’t predict the future, but the good news is that we have all the data we need to assess whether AI is causing significant job losses right now. In this study we do two things with the data that we have not seen done in other investigations of it.
First, we conduct multiple analyses of several possible labor market effects beyond simply the impact of AI on employment or unemployment.
Second, we conducted our analyses using five different measures of AI exposure drawn from four different research papers. Most research and analyses of AI’s effects to this point have used only one such measure. (For simplicity and brevity, the main text of this study presents the findings from just one measure as well, but in the Appendix we explain how our findings are similar across the other four measures.)
We believe the consistency of our findings across all of the different labor market analyses and across the five different measures of exposure gives them an added weight.
——————————————————
Who is Exposed?
Before we start looking at employment outcomes, we first need to know which workers are likely to be affected by AI and which workers are not. To assess exposure, a number of researchers have used occupation descriptions and information about the tasks that workers perform and those that AI is likely to be good at. The more tasks associated with a given occupation that AI can perform, the more exposed is a worker in that occupation.
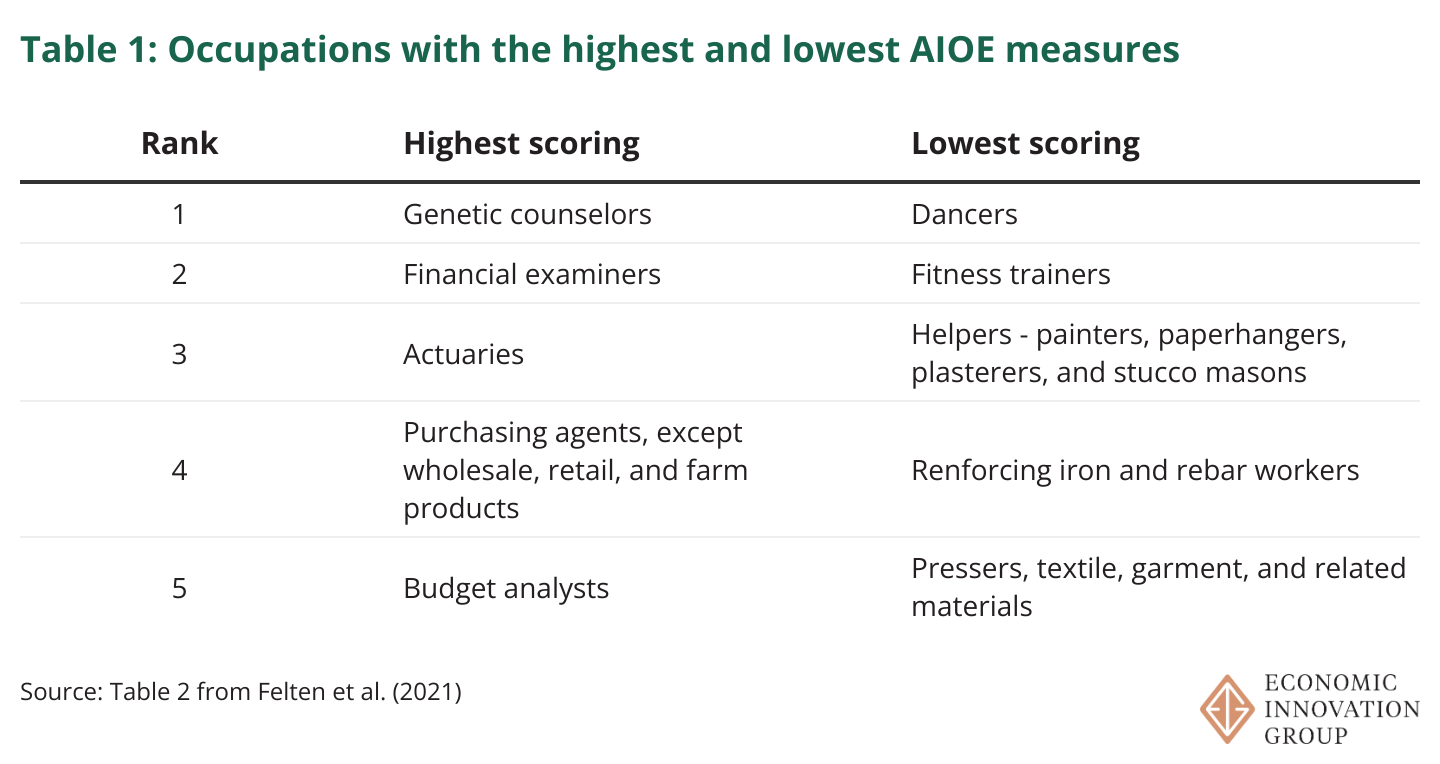
In Table 1 below, we show the most and least exposed occupations according to the AI Occupational Exposure (AIOE) measure developed by researchers Edward Felten, Manav Raj, and Robert Seamans. (See the appendix for a detailed description and comparison of the various measures of AI exposure used in other studies. We also explain why we chose the AIOE for our analyses, though it’s worth noting that our findings were similar across all the available measures.)
At the extreme ends, both the most and least exposed occupations are intuitive. The most exposed occupations include genetic counselors, who assess risk for inherited conditions using gene panels and family histories, and financial examiners, who authenticate records to ensure compliance with laws governing financial institutions. These tasks, which are heavily reliant on the standardized processing of textual information, are things AI is likely to be good at.
On the other end of the spectrum are dancers and construction helpers, who hold materials or tools and clean work areas on a construction site. These tasks, which rely on in-person physical dexterity, are naturally less exposed to AI. At least for now, chatbots cannot pirouette.
For most of our analyses we will start by splitting occupations into five equally sized groups based on their AIOE score, with quintile 1 being the least AI-exposed and quintile 5 being the most exposed. Table 2 gives a sense of what AI-exposed workers look like.
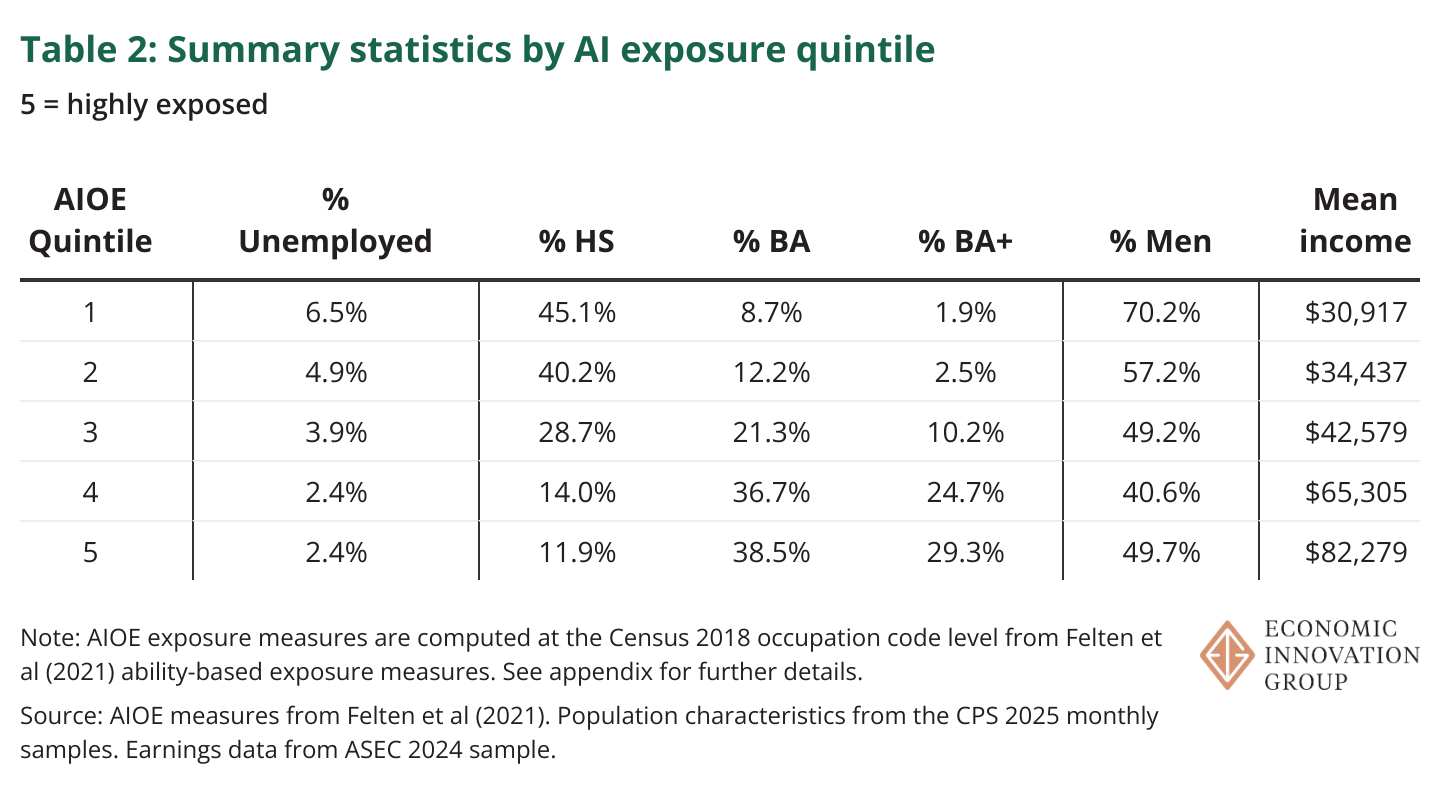
One pattern is clear in the data: highly exposed workers are doing better in the labor market than less exposed workers. Workers more exposed to AI are better paid, more likely to have Bachelor’s or graduate degrees, and less likely to be unemployed than less exposed workers.
The gender split for the quintile of workers most exposed to AI is nearly even, while 70 percent of workers who are least exposed are men.
These characteristics are important to keep in mind when thinking about the subsequent analyses, as differential patterns in labor market outcomes between the most and least exposed workers will be heavily influenced by their differences in educational attainment.
I. Is the Job Apocalypse Here?
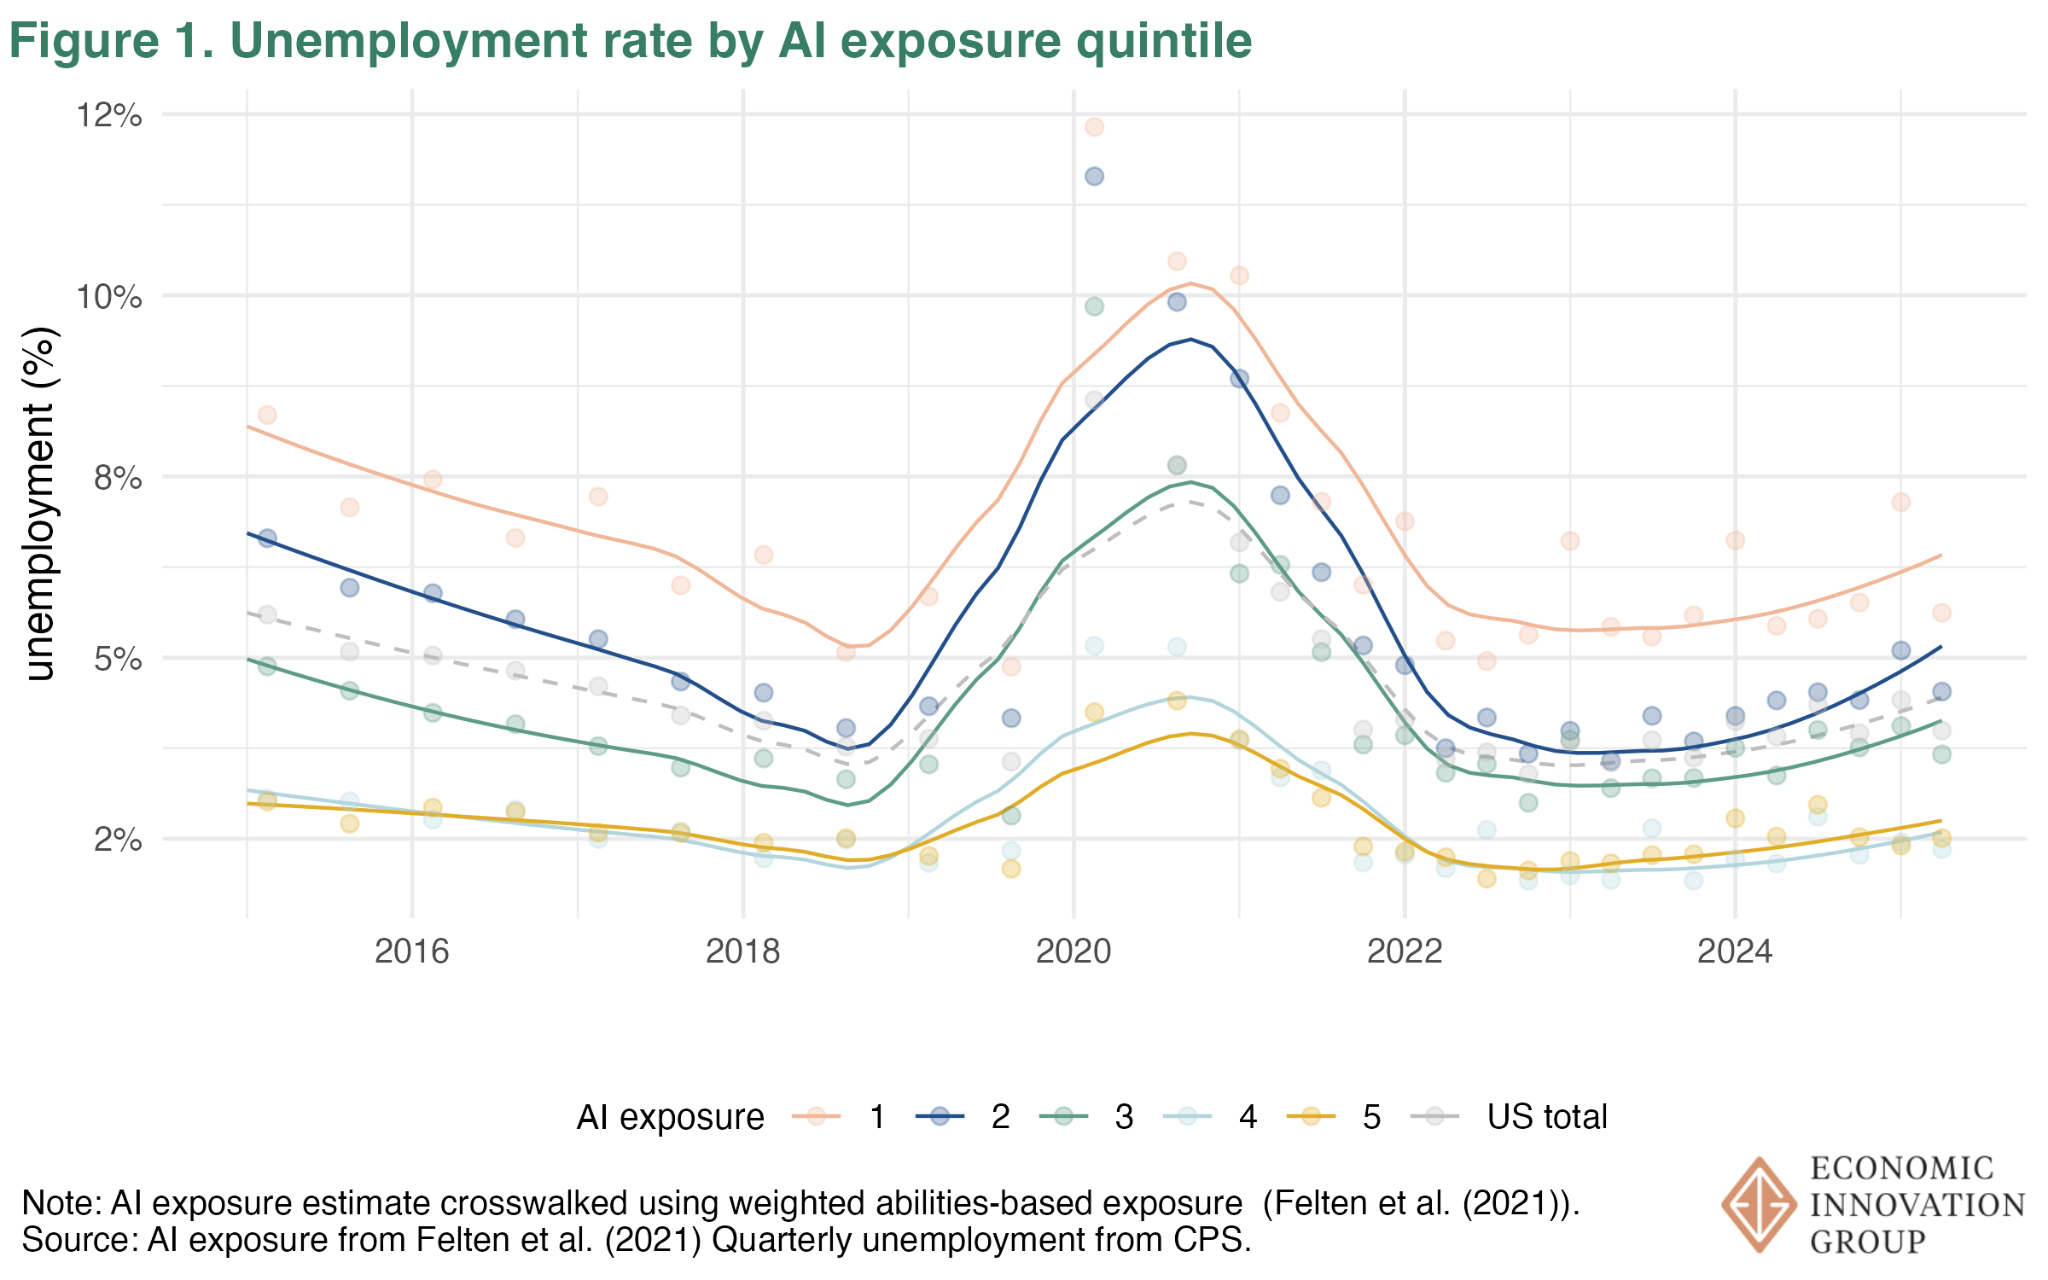
In Figure 1 below, we calculate the unemployment rate for our five groups of workers based on AI exposure.
What it shows is that although the unemployment rate for the most AI-exposed workers is indeed rising, it is actually rising even faster for the least exposed workers.
To be more precise, between 2022 and the beginning of 2025 the unemployment rate for the quintile of the most exposed workers rose by 0.30 percentage points. For the quintile of the least exposed workers, it climbed by 0.94 percentage points. The unemployment rate also climbed during this period for the other three quintiles.
By the most obvious measure, then, the effect of AI on jobs is invisible. But what about less obvious measures?
II. Bailing on Work?
Even though we see little evidence of AI’s impact on unemployment, maybe it’s because we are looking underneath the wrong lamppost. Rather than falling into unemployment, workers displaced by AI might be exiting the labor force entirely. Older workers, for example, might see the AI writing on the wall and decide to pack up and retire.
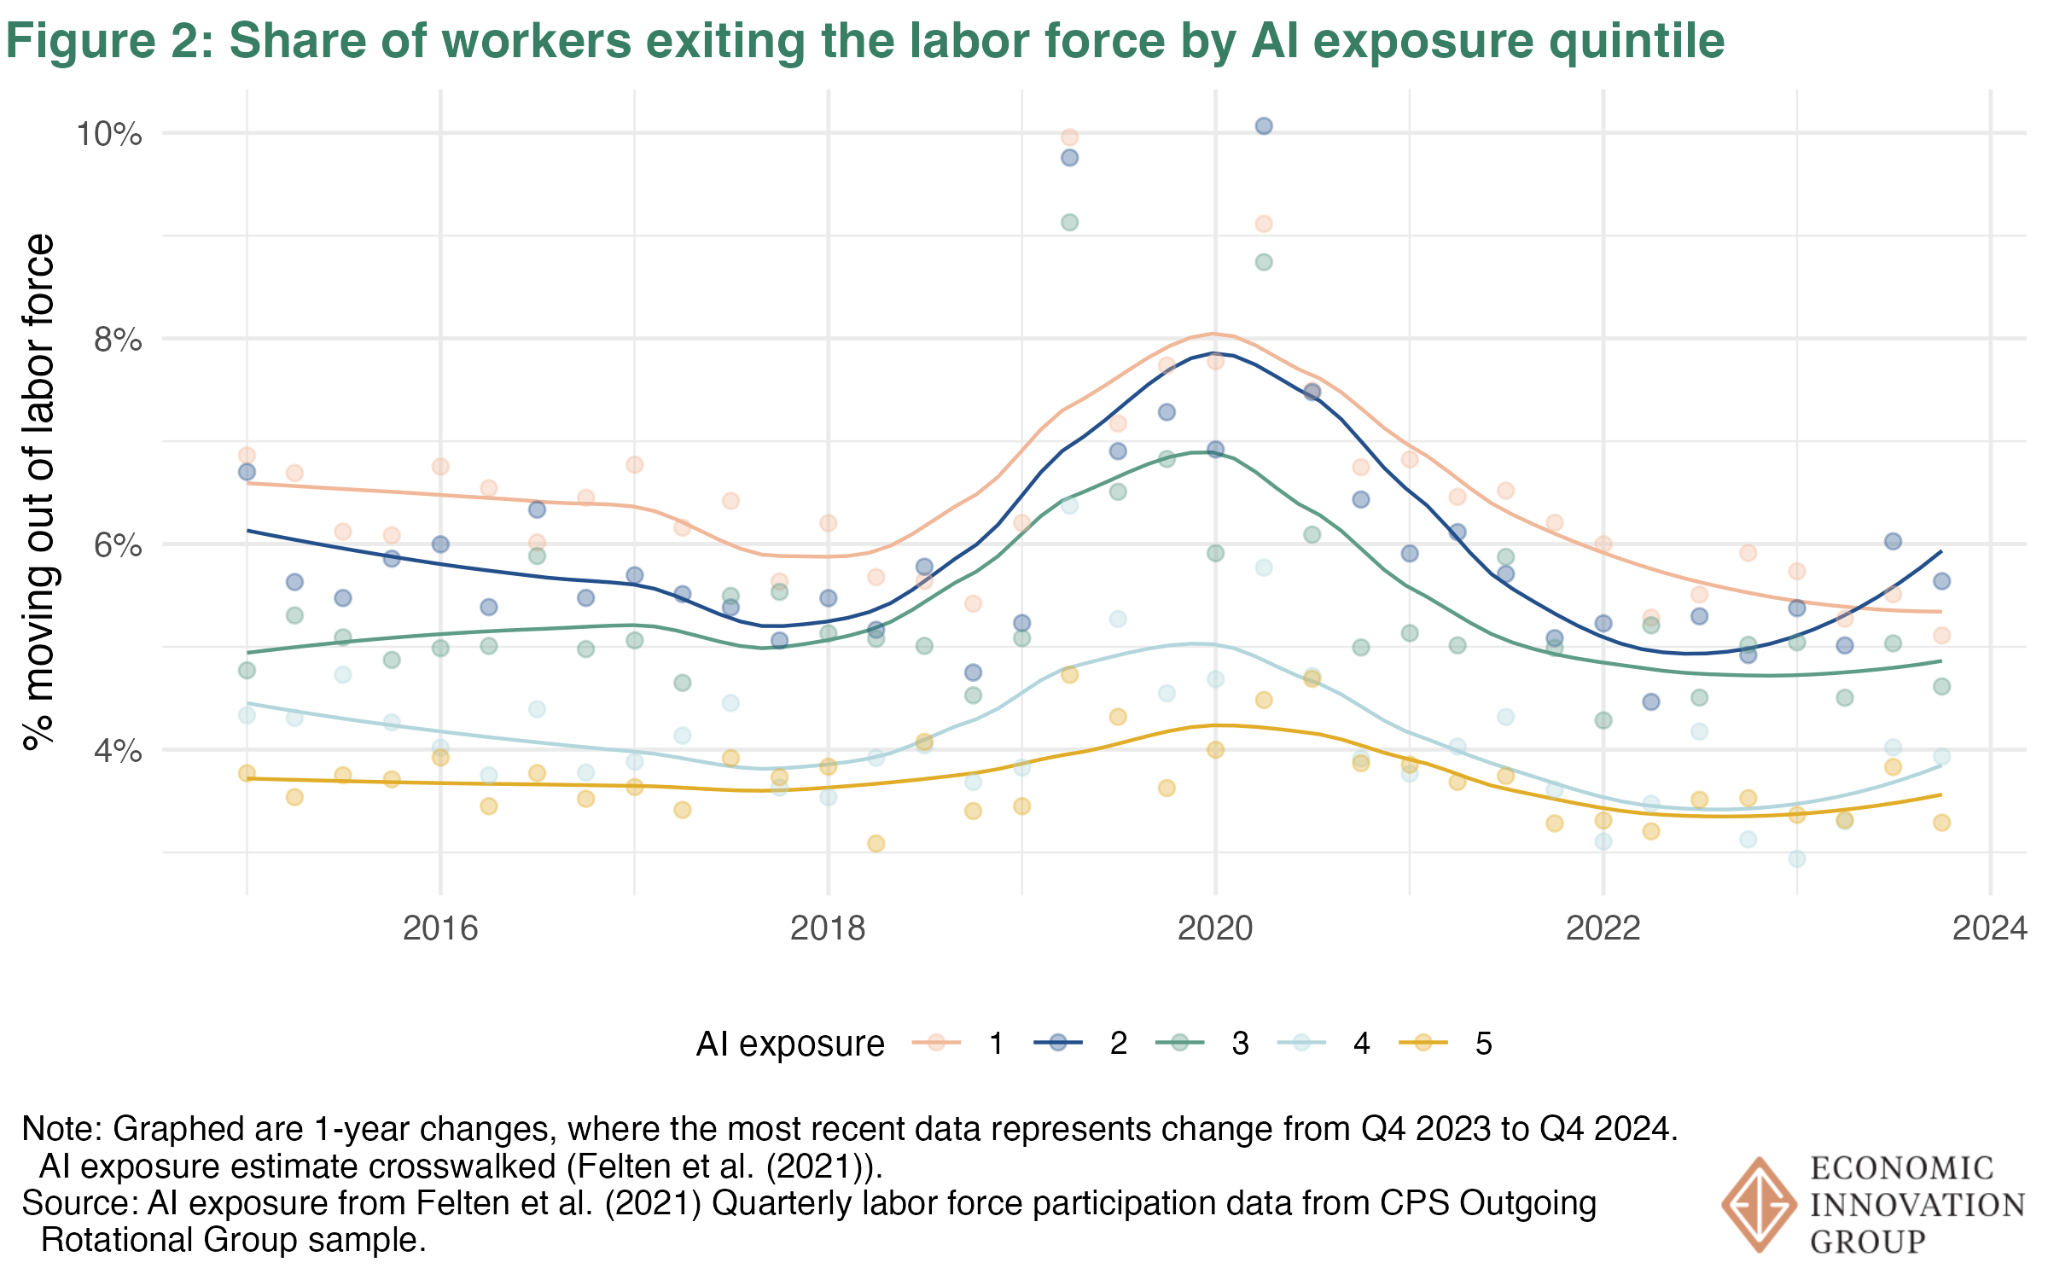
In Figure 2 we widen our lens, showing the percent of workers exiting the labor force by AI-exposure groups. Specifically, for each worker in a given AI-exposure group, we look at the probability that the worker is not in the labor force a year later.
Once again the disruptive effect of AI fails to appear. Highly exposed workers aren’t running for the exits and, in fact, the share exiting the labor force is actually the lowest for the most AI-exposed workers, and has been roughly flat since 2022.
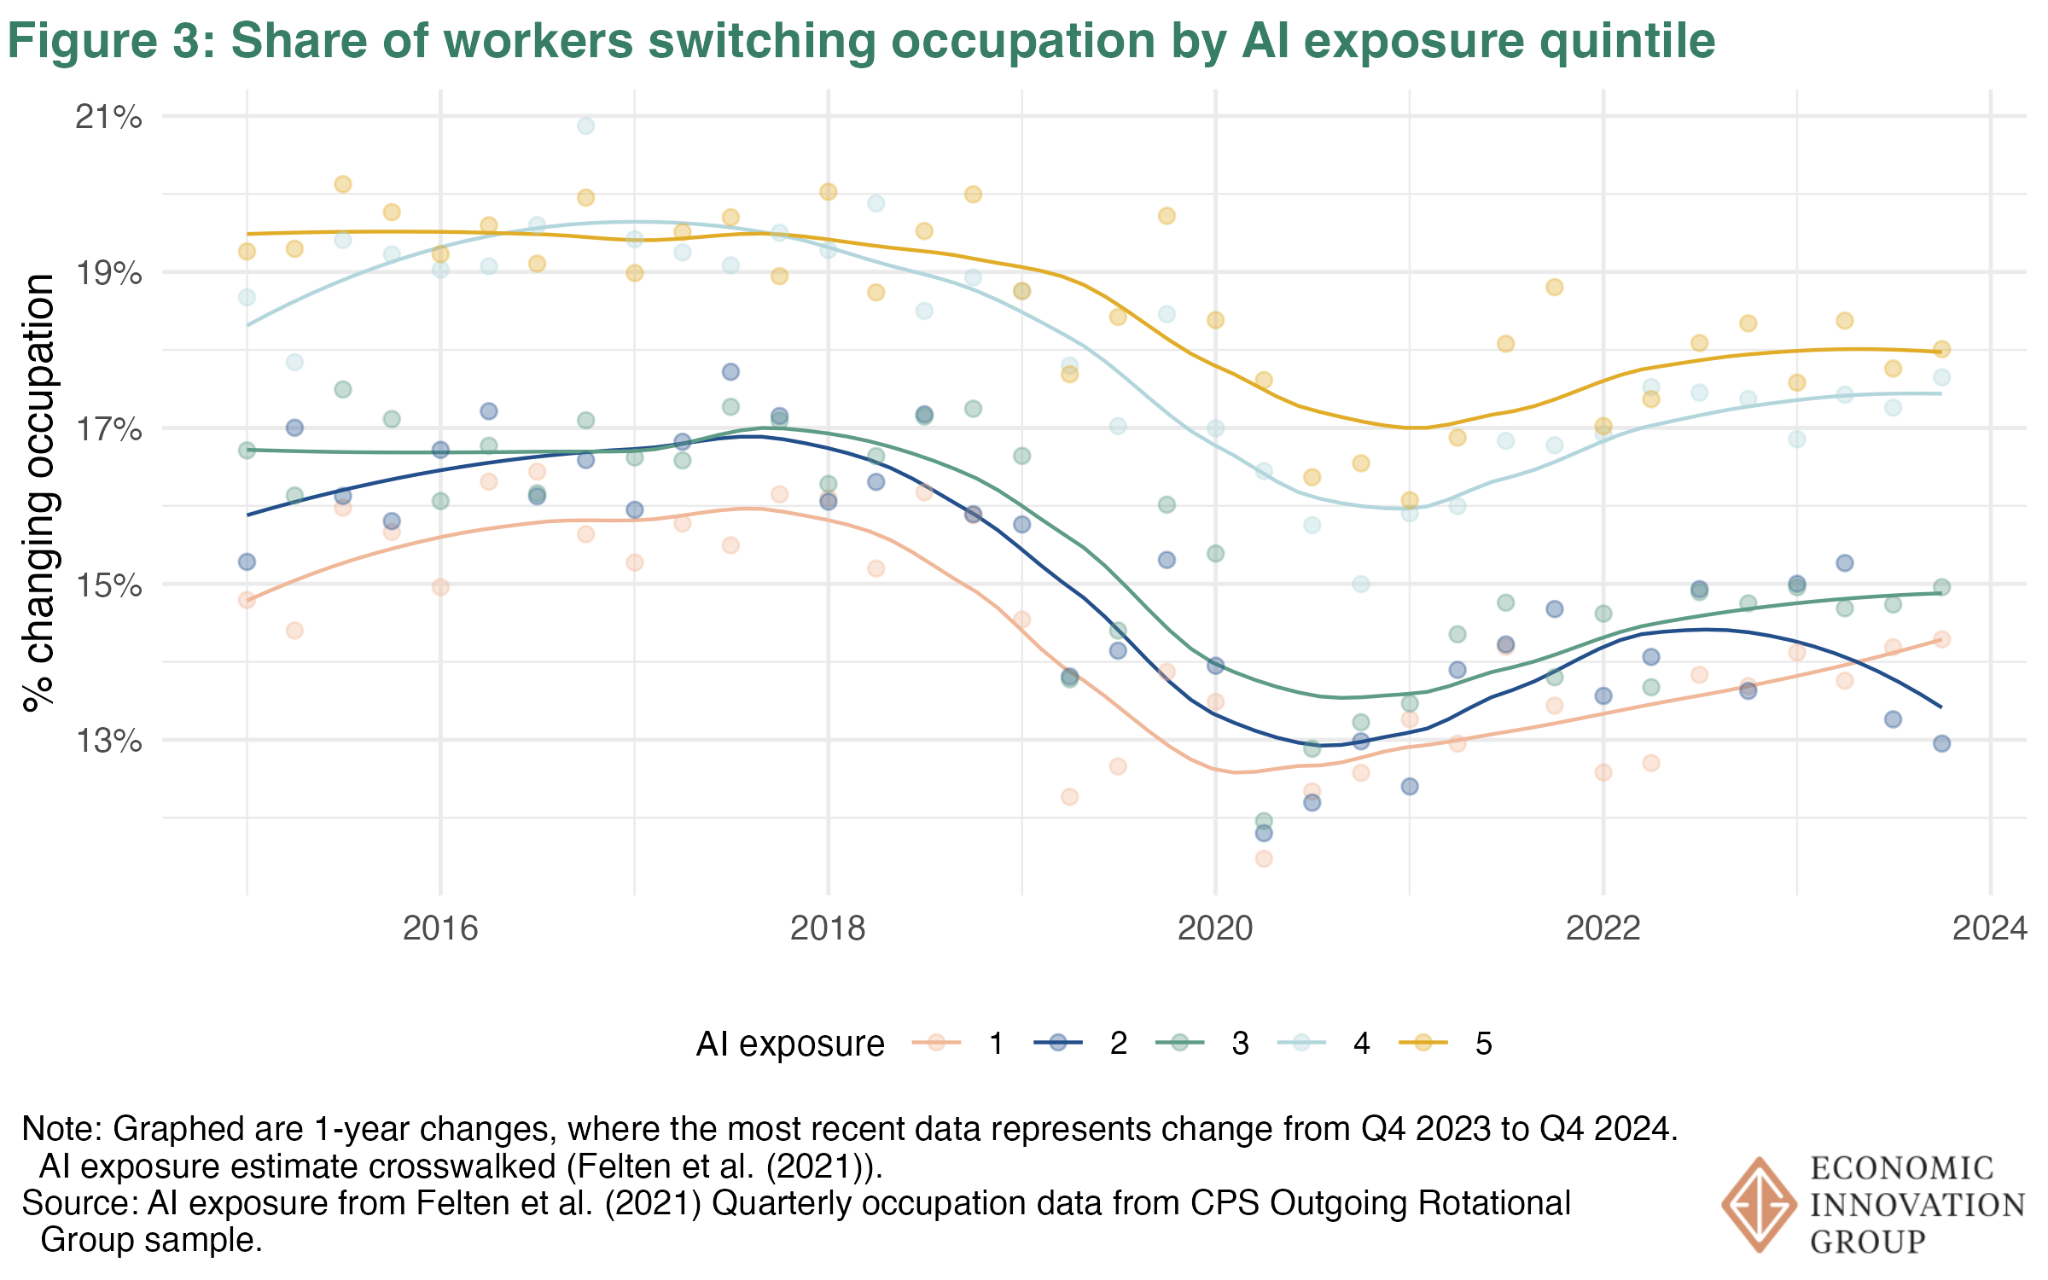
III. Lateral Movement
Another response to AI-driven job displacement could be occupational switching. That is, maybe we don’t see rising unemployment or falling participation among highly exposed workers because they’re changing careers into less exposed occupations. Maybe computer programmers are becoming ballerinas.
To find out, we can again use the year-ahead framing. For a worker in a highly AI-exposed occupation in a given month, what is the probability that a year later they 1) work in a different occupation, or 2) work in a lower AI-exposed occupation?
Answering the first question gives us a sense of overall occupational switching by AI exposure. If AI diffusion is not uniform among our most-exposed workers, then highly exposed workers may switch occupations but remain in the same exposure group. Answering the second question offers a sense of whether highly exposed workers are fleeing to occupations with less of a risk that AI will affect their work.
As shown in Figure 3 below, highly AI-exposed workers tend to change occupations more often, but that probability is roughly flat since mid 2022 and remains lower than it was pre-COVID. It doesn’t look like workers more exposed to AI are changing occupations more than they used to.
As for the second question, the likelihood that the most AI-exposed workers switch to less exposed occupations began falling in 2019, dipped even lower during the pandemic, and now remains well below its 2018 level.
It simply does not look like AI-exposed workers are retreating to occupations with less exposure.
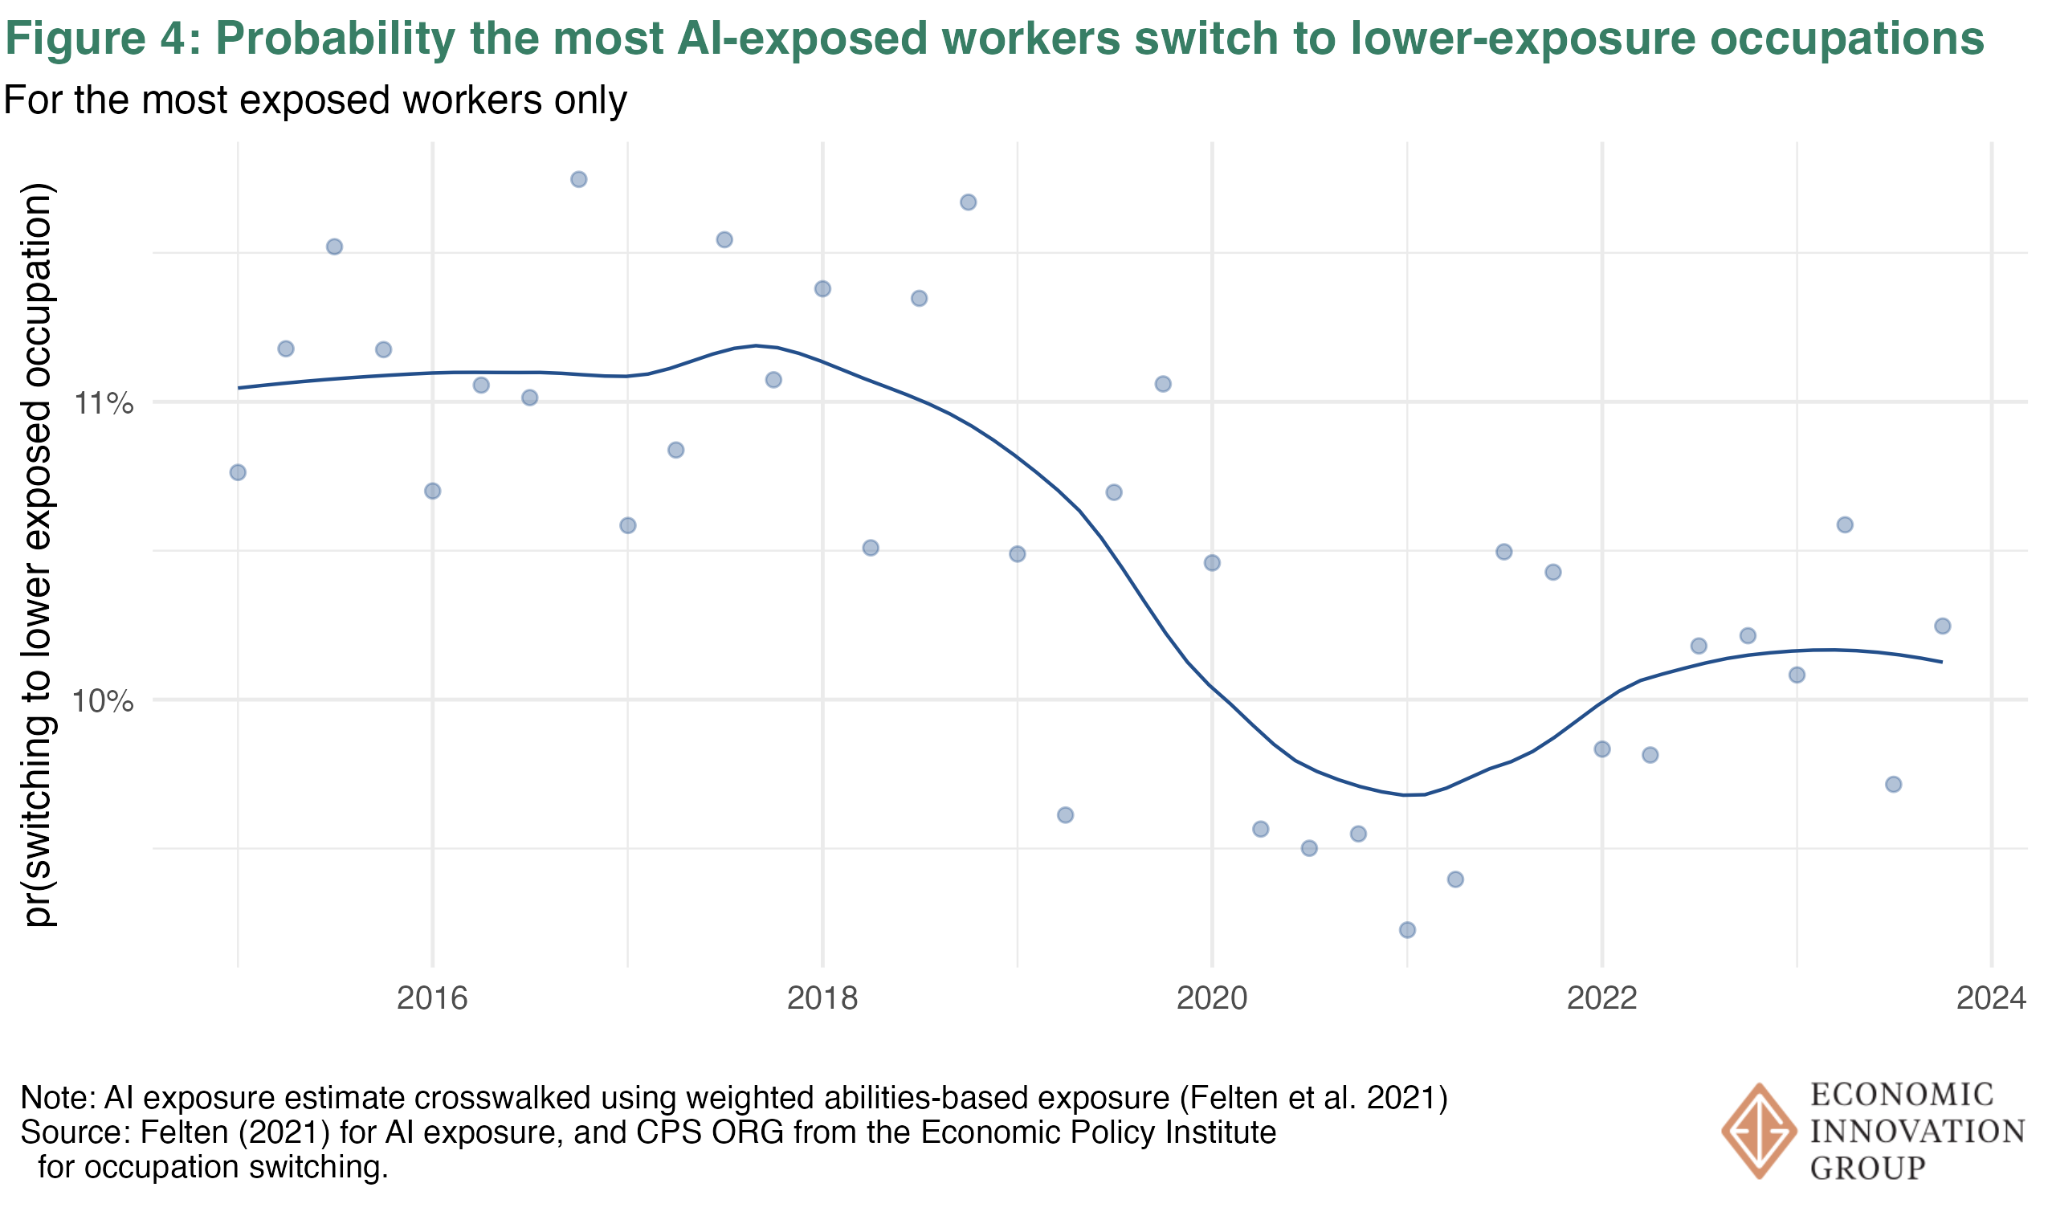
Another swing, another miss.
IV. Broadening the Scope: Firm Behavior
Yet another possibility is that we can’t see the impact of AI on the labor market because, to this point, we have focused on data about workers. Perhaps the trend we are looking for is happening at the firm level.
Firms might be reallocating tasks across workers in such a way that higher unemployment doesn’t impact the most AI exposed workers.
What might this look like? Suppose a firm has one high-skilled worker and two low-skilled workers. Imagine that AI can perform a third of the tasks done by the high-skilled worker. The firm may respond to this by reallocating tasks from one or both of the low skill workers to the high skill worker, reducing the firm’s total employment but not putting the AI-exposed worker out of a job. In this scenario, AI does have a dis-employment effect, but it does not fall on the AI-exposed worker.
This also highlights why it matters that our AIOE measure does not distinguish between AI exposure that displaces workers and exposure that augments them. The high-skilled worker, in our example, might use AI to conduct the tasks previously done by the low-skilled workers. Aided by AI, high-skilled workers might have broader roles and work in smaller teams.
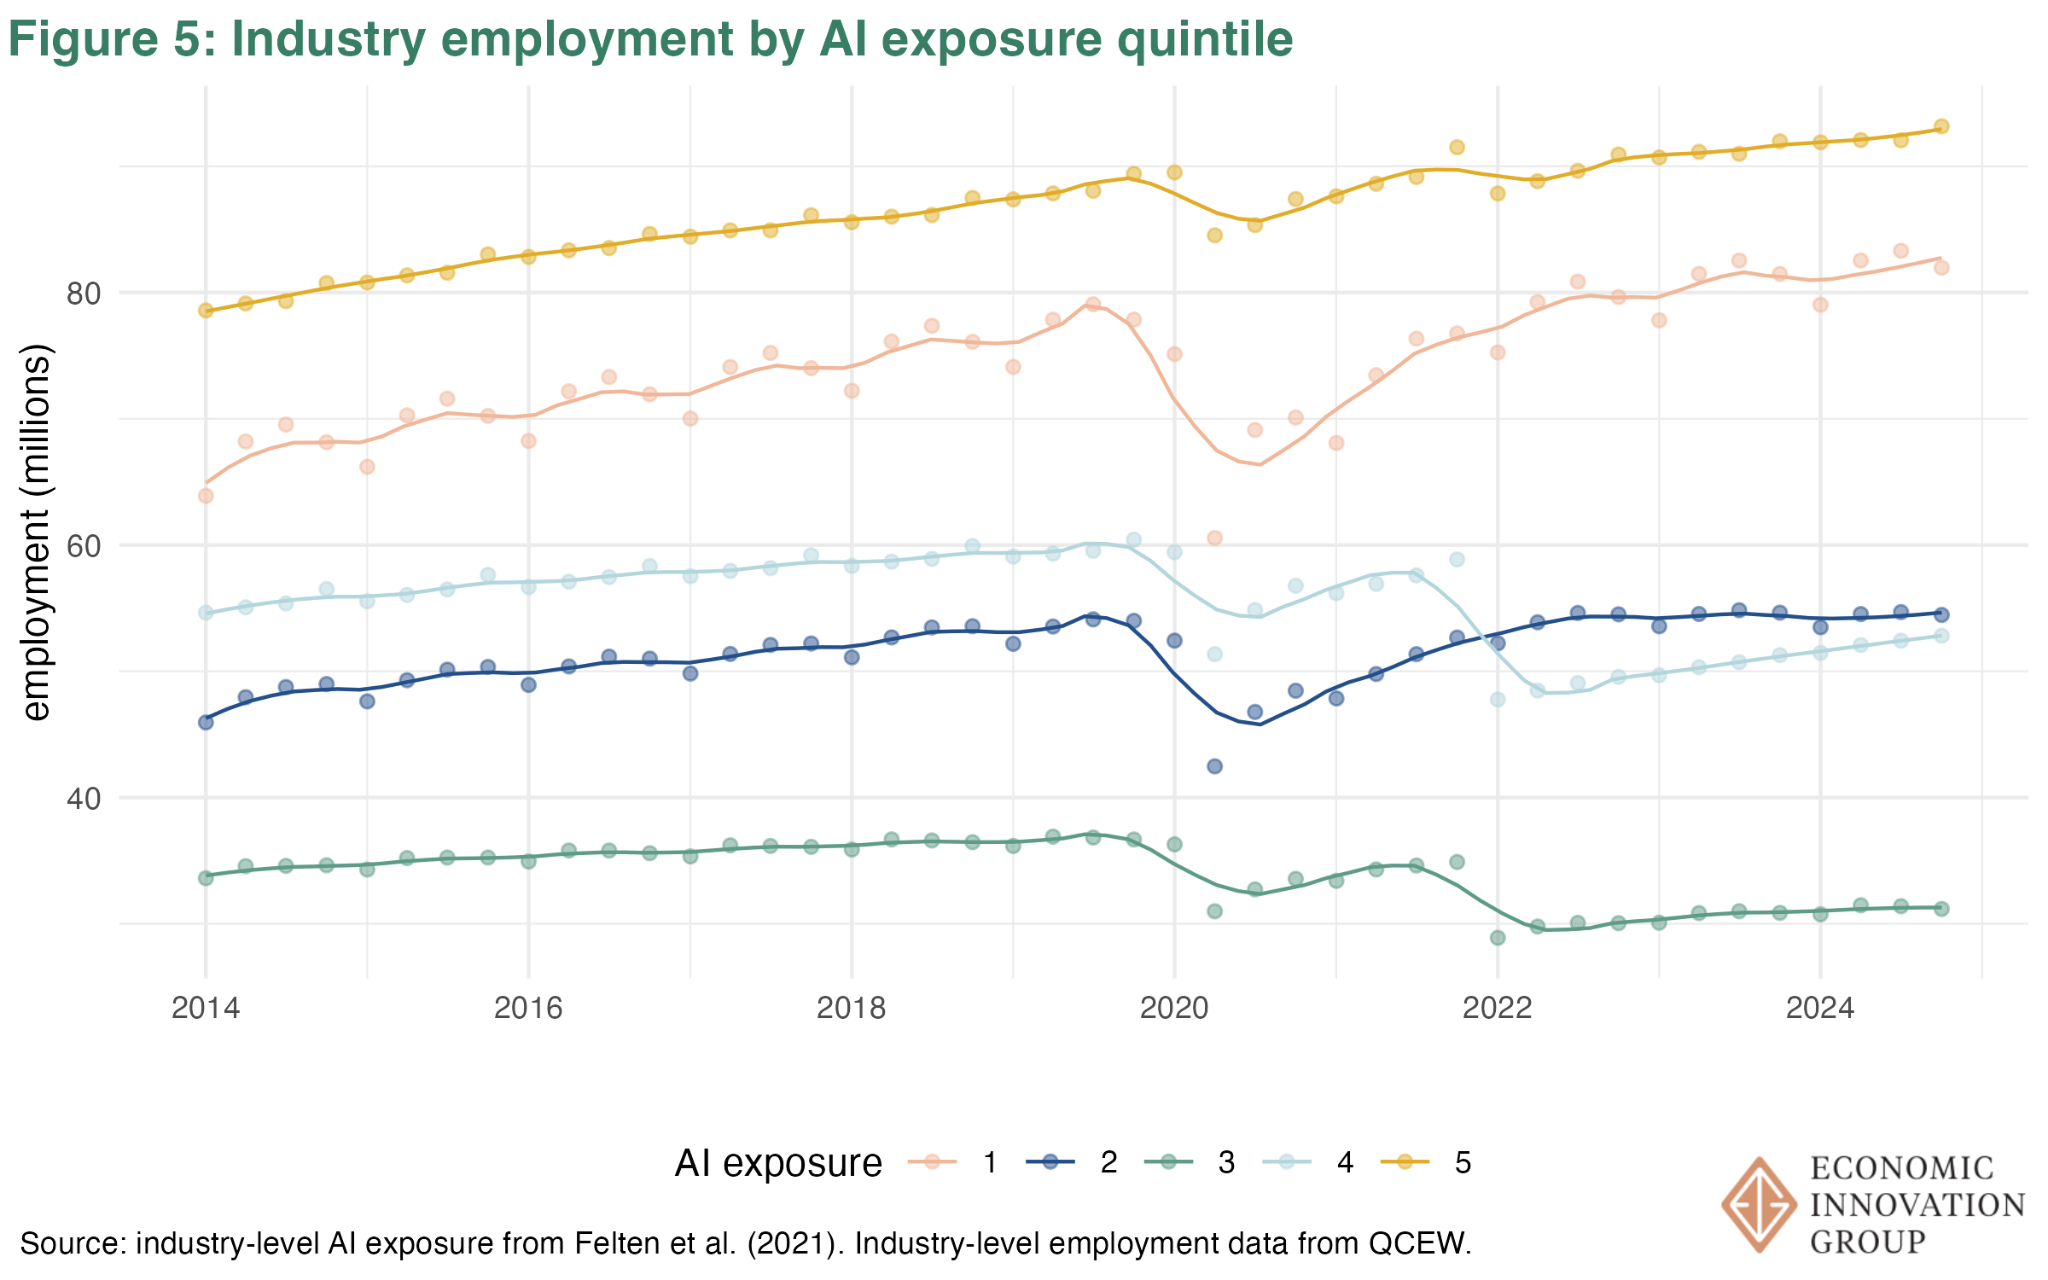
How could we see this in the data? A reasonable place to start is industry-level employment. Industries with more exposed workers should see declining employment as firms get smaller, even if the AI-exposed workers stick around.
Figure 5 groups industries based on their employment of AI-exposed workers, similar to how we grouped occupations. It shows total employment for industries in each group. Once again the effect of AI doesn’t leap from the page. Industries with the most AI-exposed workers account for a larger share of total employment and have enjoyed a steady increase post-COVID.
Something that an industry analysis like this one will struggle to capture is AI’s effect on new hires. Much has been made of the rising unemployment rates among recent graduates. Since new labor market entrants, like recent college graduates, are a small portion of the labor force, they may not show up in this industry-level analysis.[1] To understand the effects on young workers and recent college graduates, we need to look at them directly.
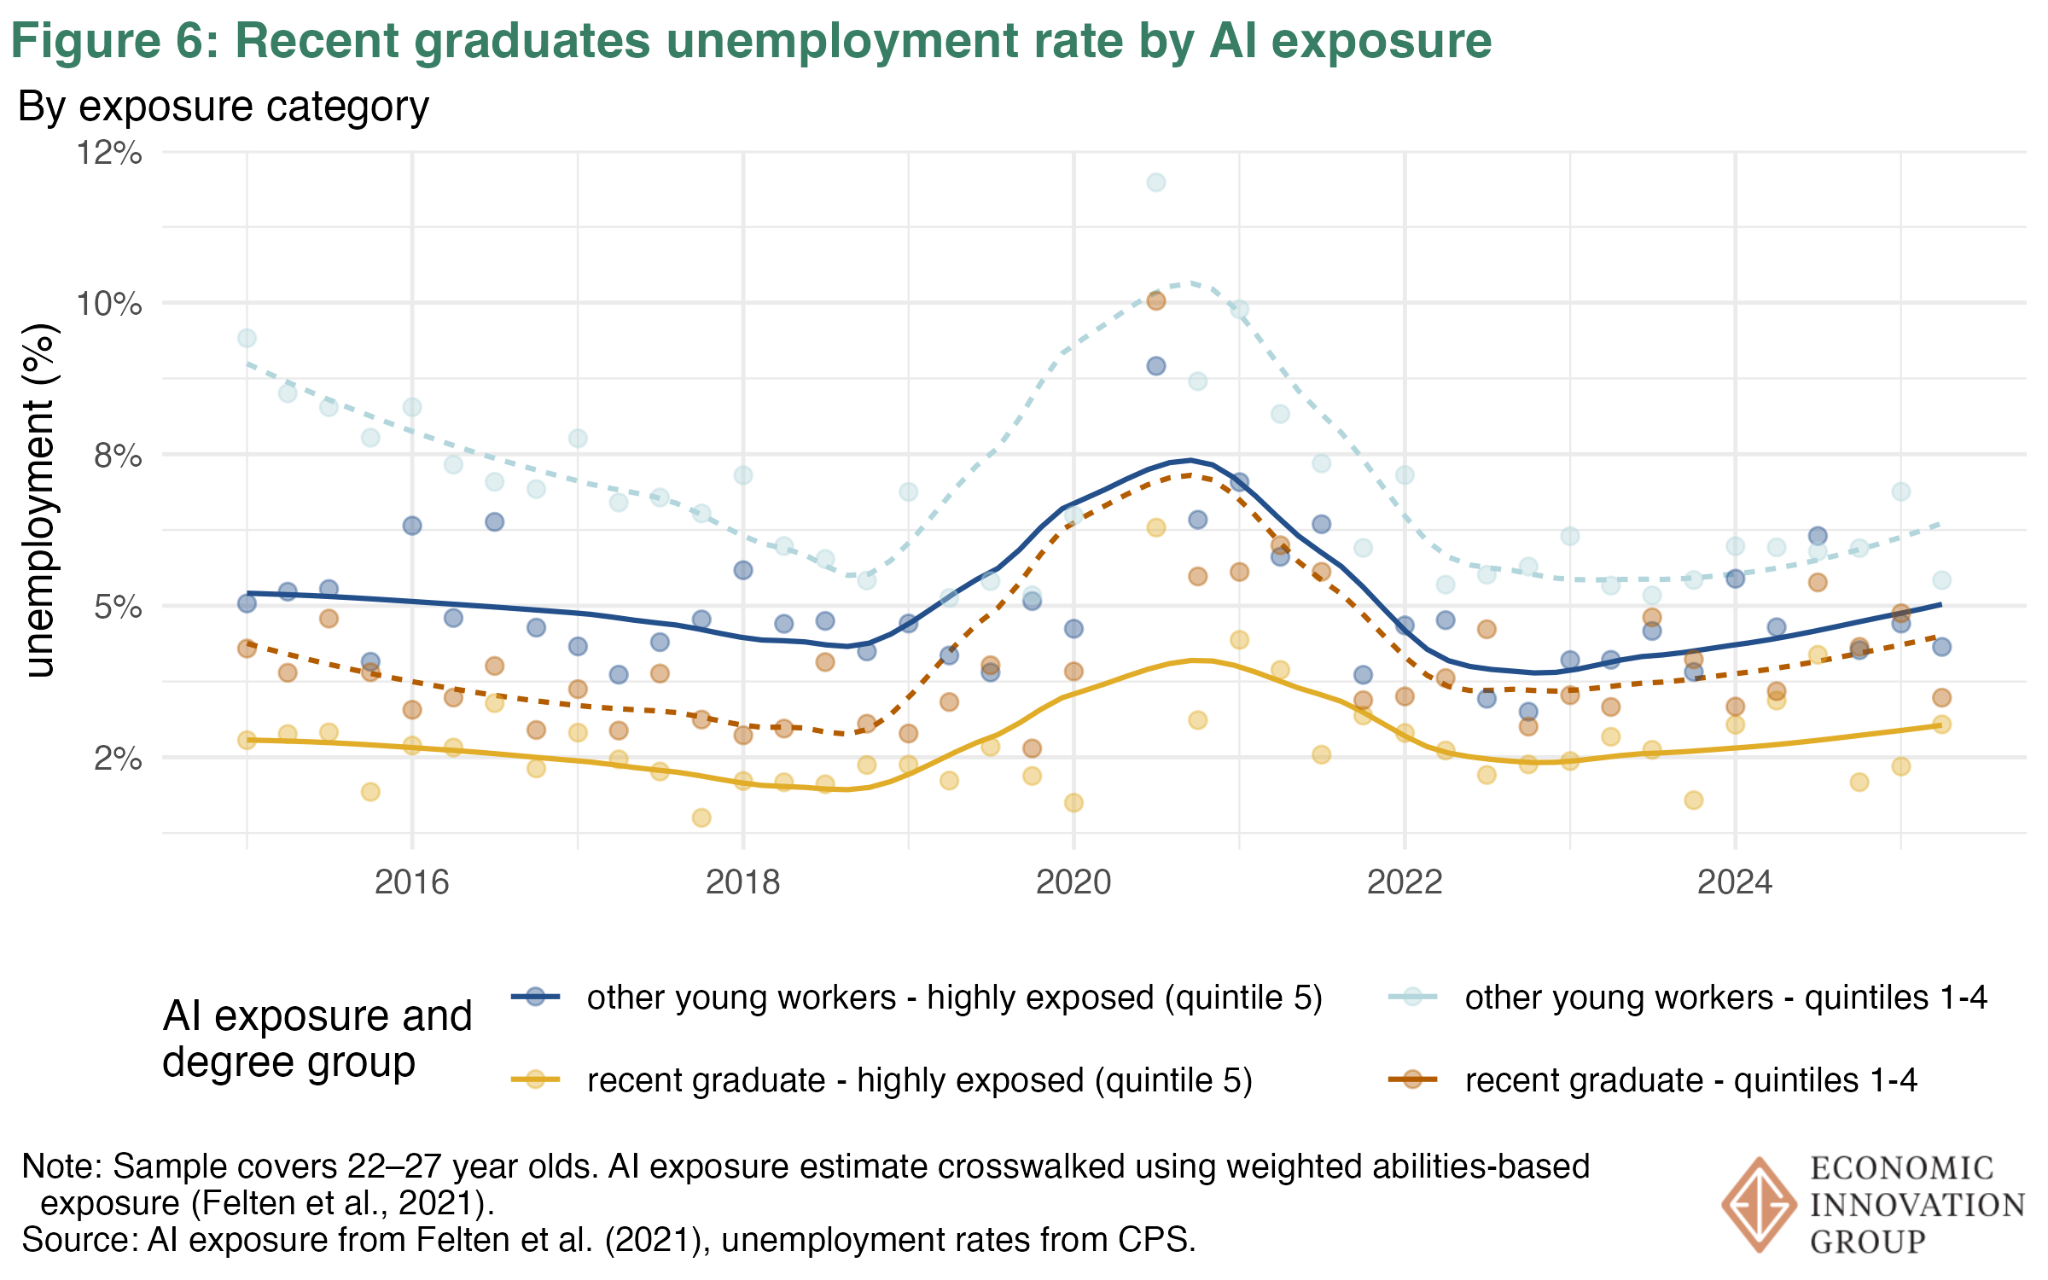
Is it the case that young workers or recent college graduates going into occupations more exposed to AI have worse labor market outcomes?
It appears not. The two solid lines in Figure 6 show the unemployment rate for the most AI-exposed young workers (blue) and recent college graduates (yellow). The associated dashed lines show the unemployment rate for less exposed young workers and recent college graduates.[2]
Unemployment rates have been creeping up for young workers and recent graduates alike, whether they are AI-exposed or not.
V. Diffusion: The Last Hope
No big AI effects so far, but this could be because the actual diffusion of AI in the economy is slower than we expected. The Census Bureau asks businesses whether or not they use AI in the production of goods or services. A year and a half ago, only 5 percent said yes. The share is rising fast and is now at about 9 percent, but that remains a low figure. (See the appendix for a visualization of this trend. And note also that using AI in the production of goods and services is different from using it for incidental tasks like summarizing memos.)
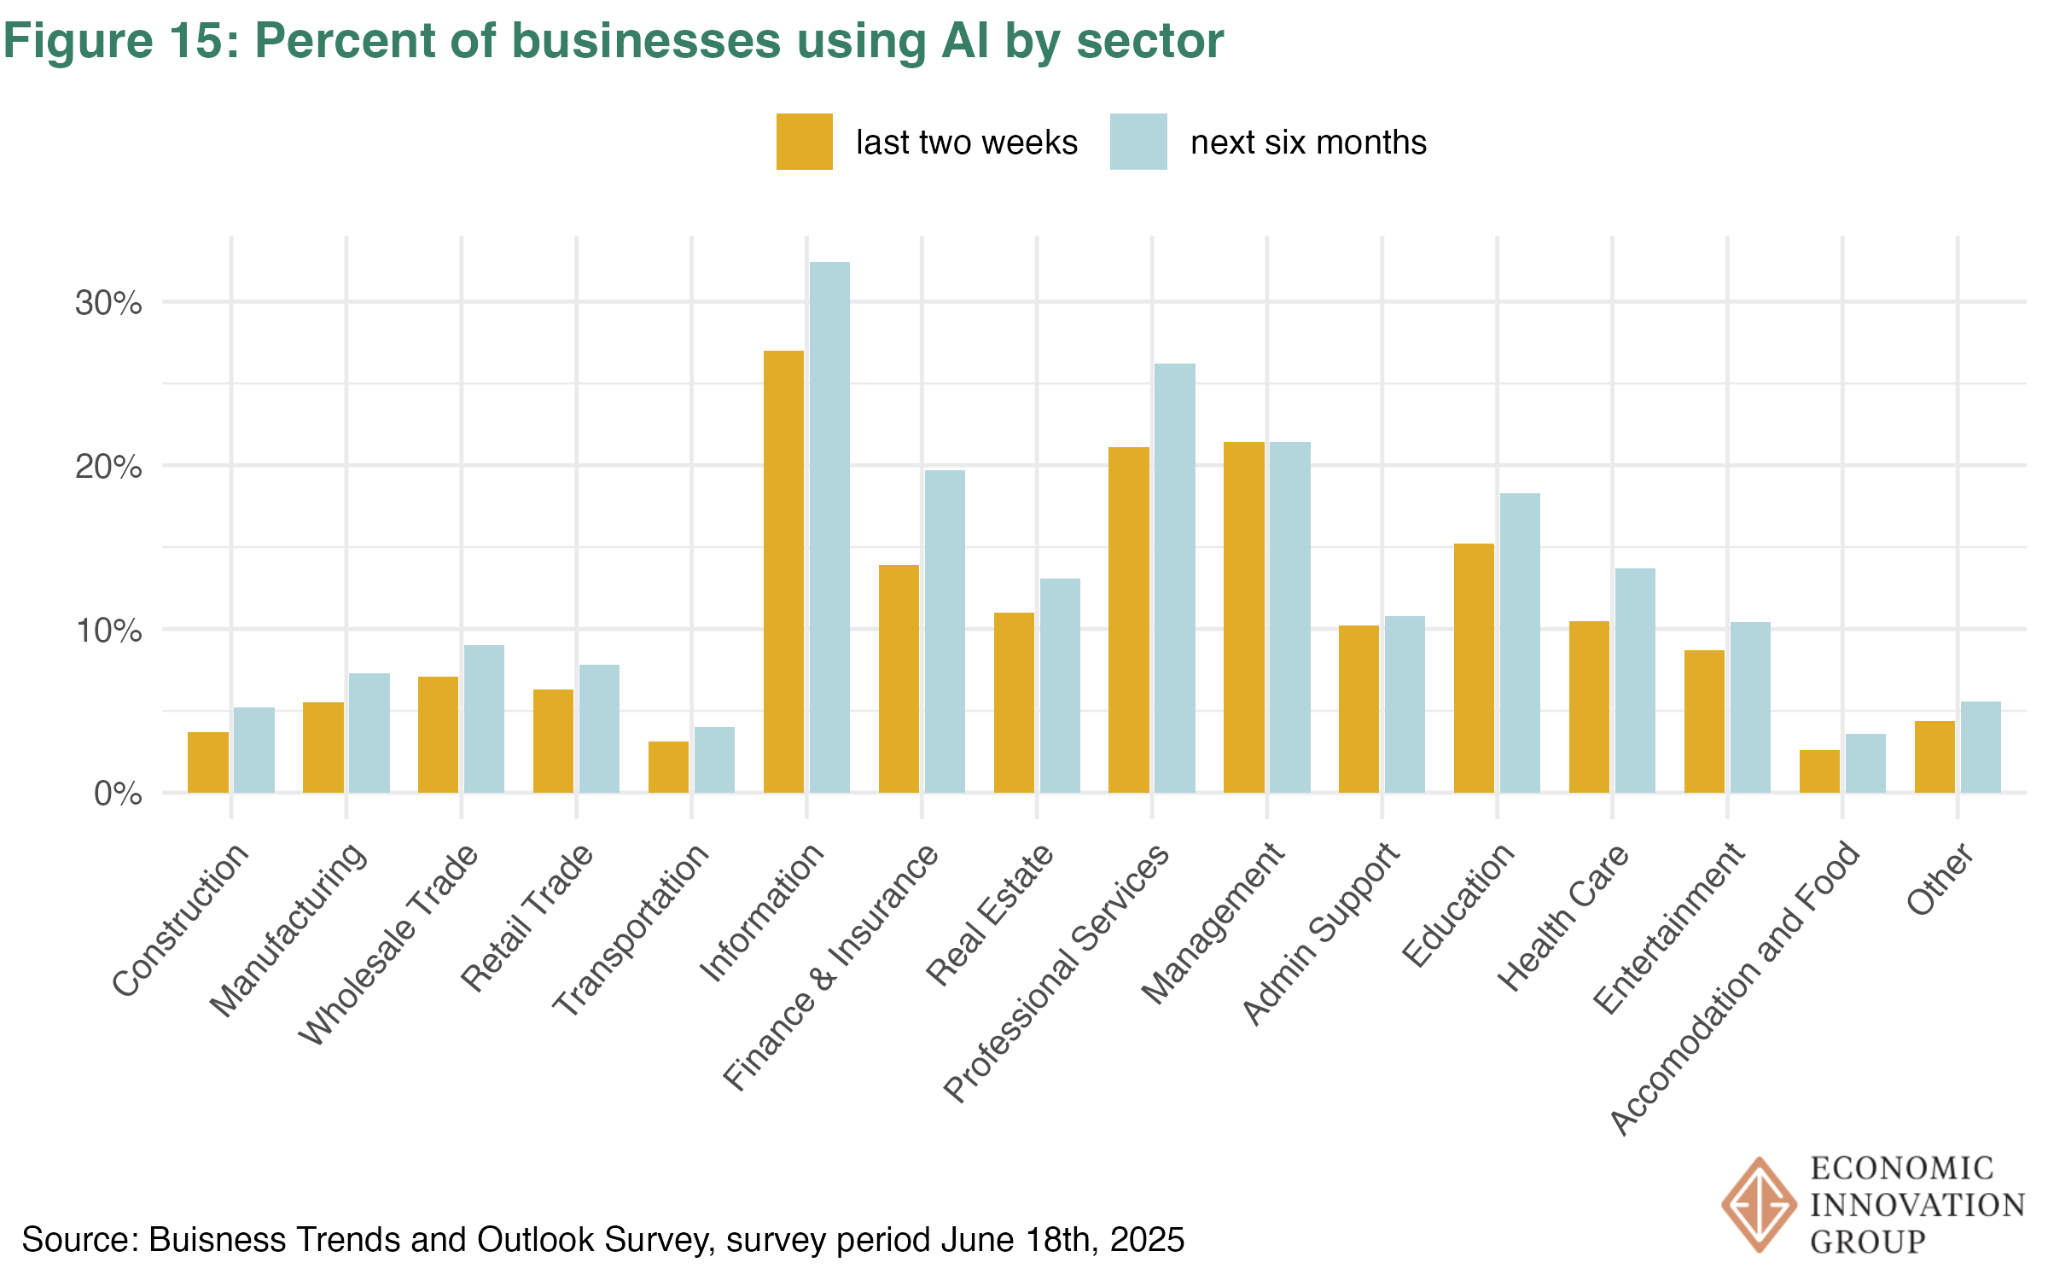
That economy-wide 9 percent doesn’t tell the whole story though. There are some sectors where AI use is much higher. About 27 percent of businesses in the information sector say they use AI.
Perhaps the effects of AI will finally appear in the employment trends of the information sector. We can look for them in Figure 7, which shows employment in each subsector of the overall information sector.
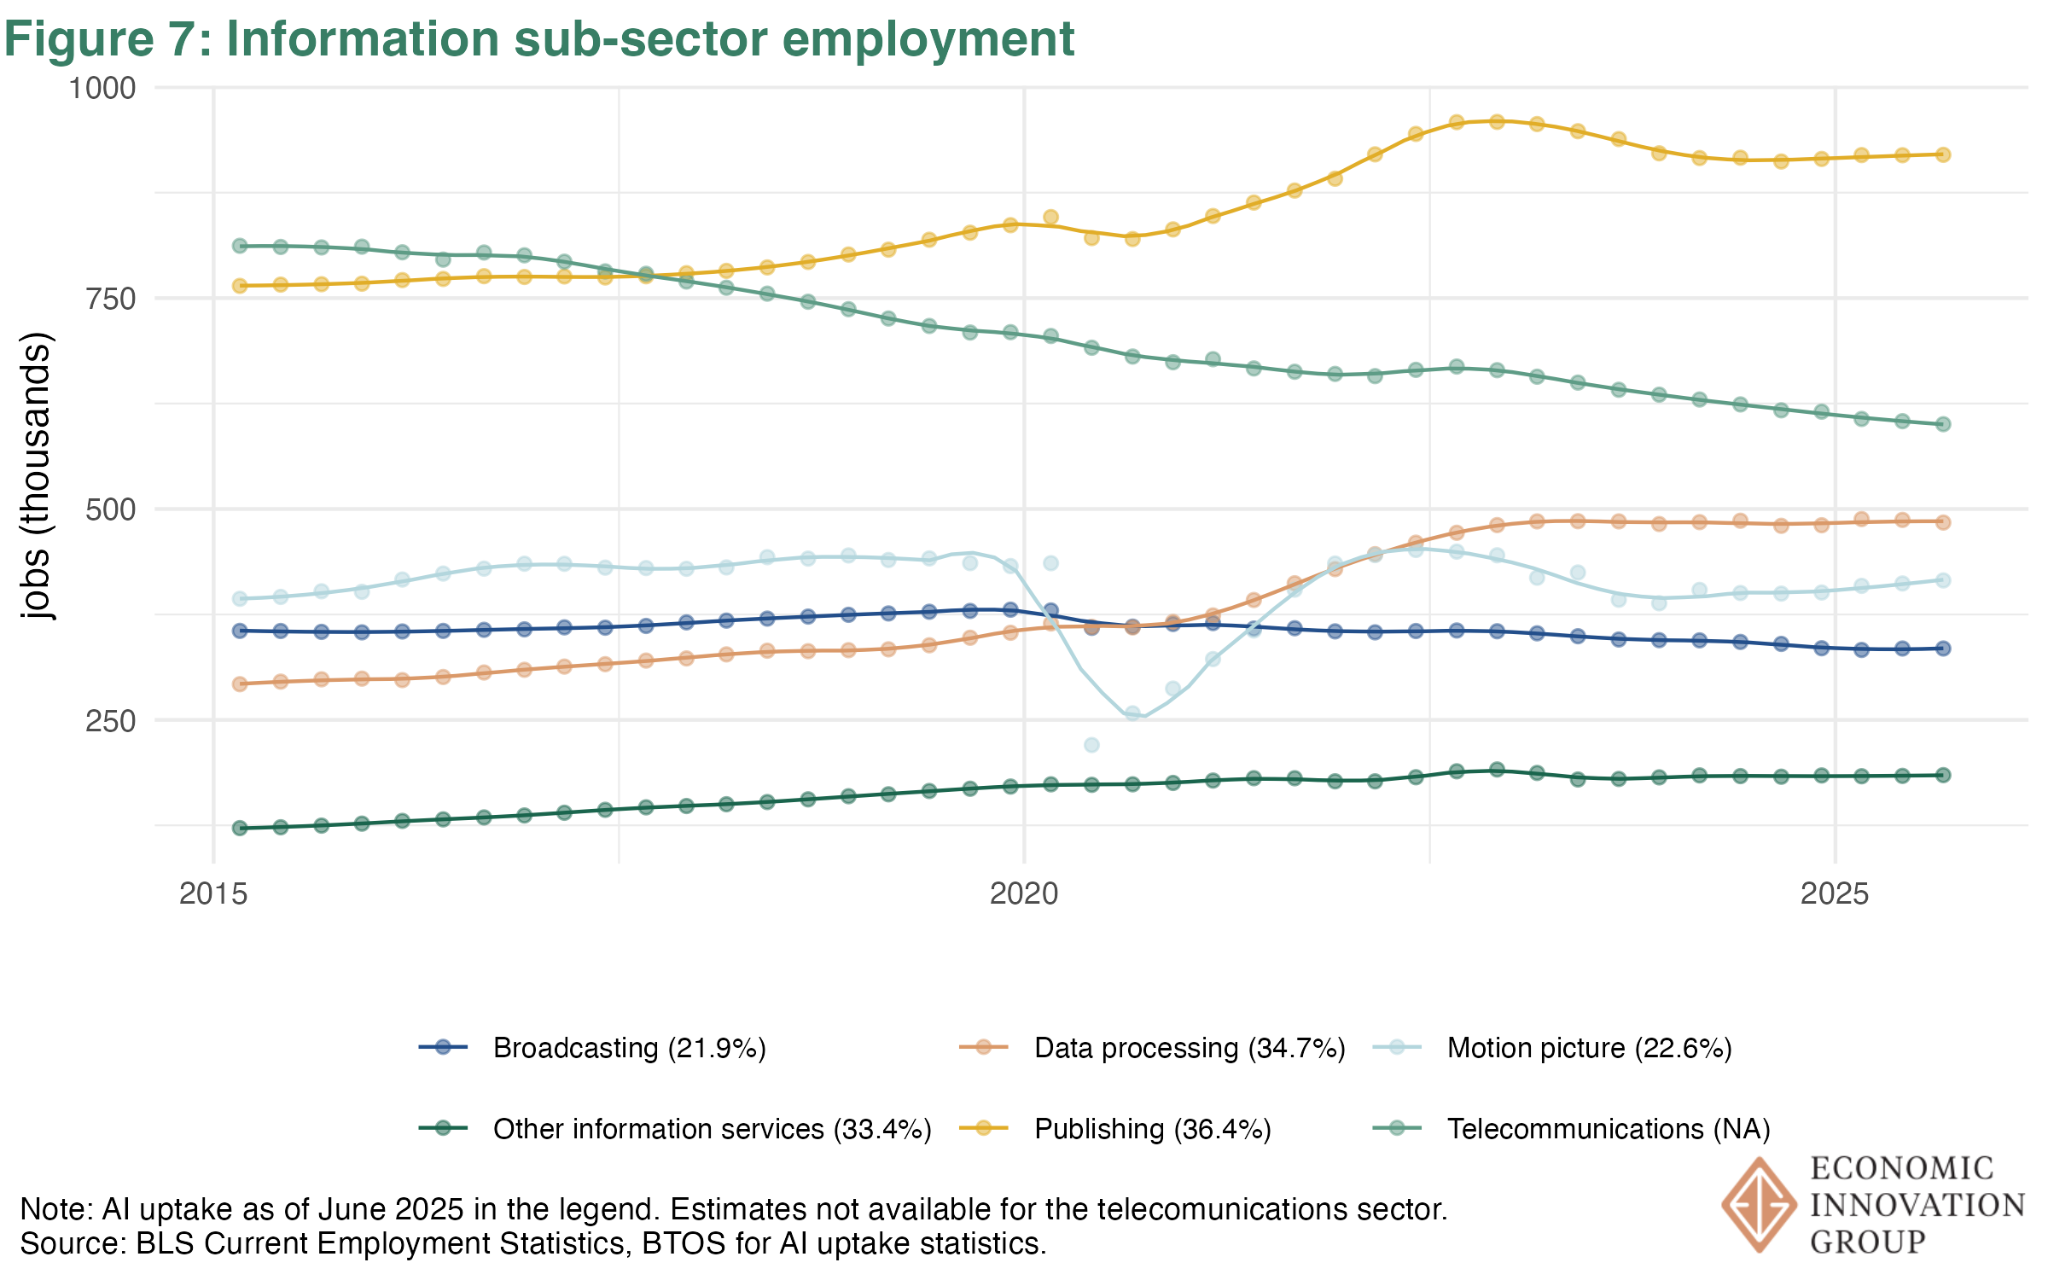
The subsector with the highest use rate, publishing industries, where 36 percent of businesses report using AI, had a post-COVID surge in employment that then retreated and leveled off above its pre-COVID level, but is still below the 2021–23 trend.
Data processing and computing, which has the second highest AI use rate (35 percent), was rising until 2023 and has been flat since.
Two cases where employment had been growing and then flattened in the past few years — so have we finally found the effects of AI? If so, the effect is extremely modest, more of a brake, perhaps even just a temporary break, on employment growth in a few subsectors of the economy rather than anything that suggests a meaningful threat to jobs.
More importantly, though, there is no way to know whether AI specifically is the cause of the flatlining in those subsectors. In both cases, for instance, employment growth was quite healthy in the year right after COVID. Maybe companies simply realized they had expanded too quickly and wanted to slow down. Or it could be something else. The lack of causal evidence is a problem, in fact, not just for all of our analyses presented here but also for any investigation that uses the available measures of AI exposure. We expand on the point in the next section.
Still Haven’t Found What We’re Looking For
Why, no matter how we cut the data, do we not see any meaningful AI impacts in the labor market? We consider two possibilities.
Garbage-In Garbage-Out?
It could be that our occupation and industry classification doesn’t do a great job of differentiating where AI is actually having an impact. Lucky for us, there are a number of academic studies that attempt to identify AI-exposure in the labor market, some of which use significantly different methods of identifying what workers are likely to be affected by AI. (See appendix.) Some use human-curated lists of exposure and some even use AI to classify which tasks are exposed to AI.
We’ve run our analyses with each of these different measures and the results are broadly consistent. The trendlines in the unemployment rates for the most AI-exposed workers, for example, look fairly similar across all of the measures. The same goes for exiting the labor force, changing occupations, and switching to lower exposure occupations.
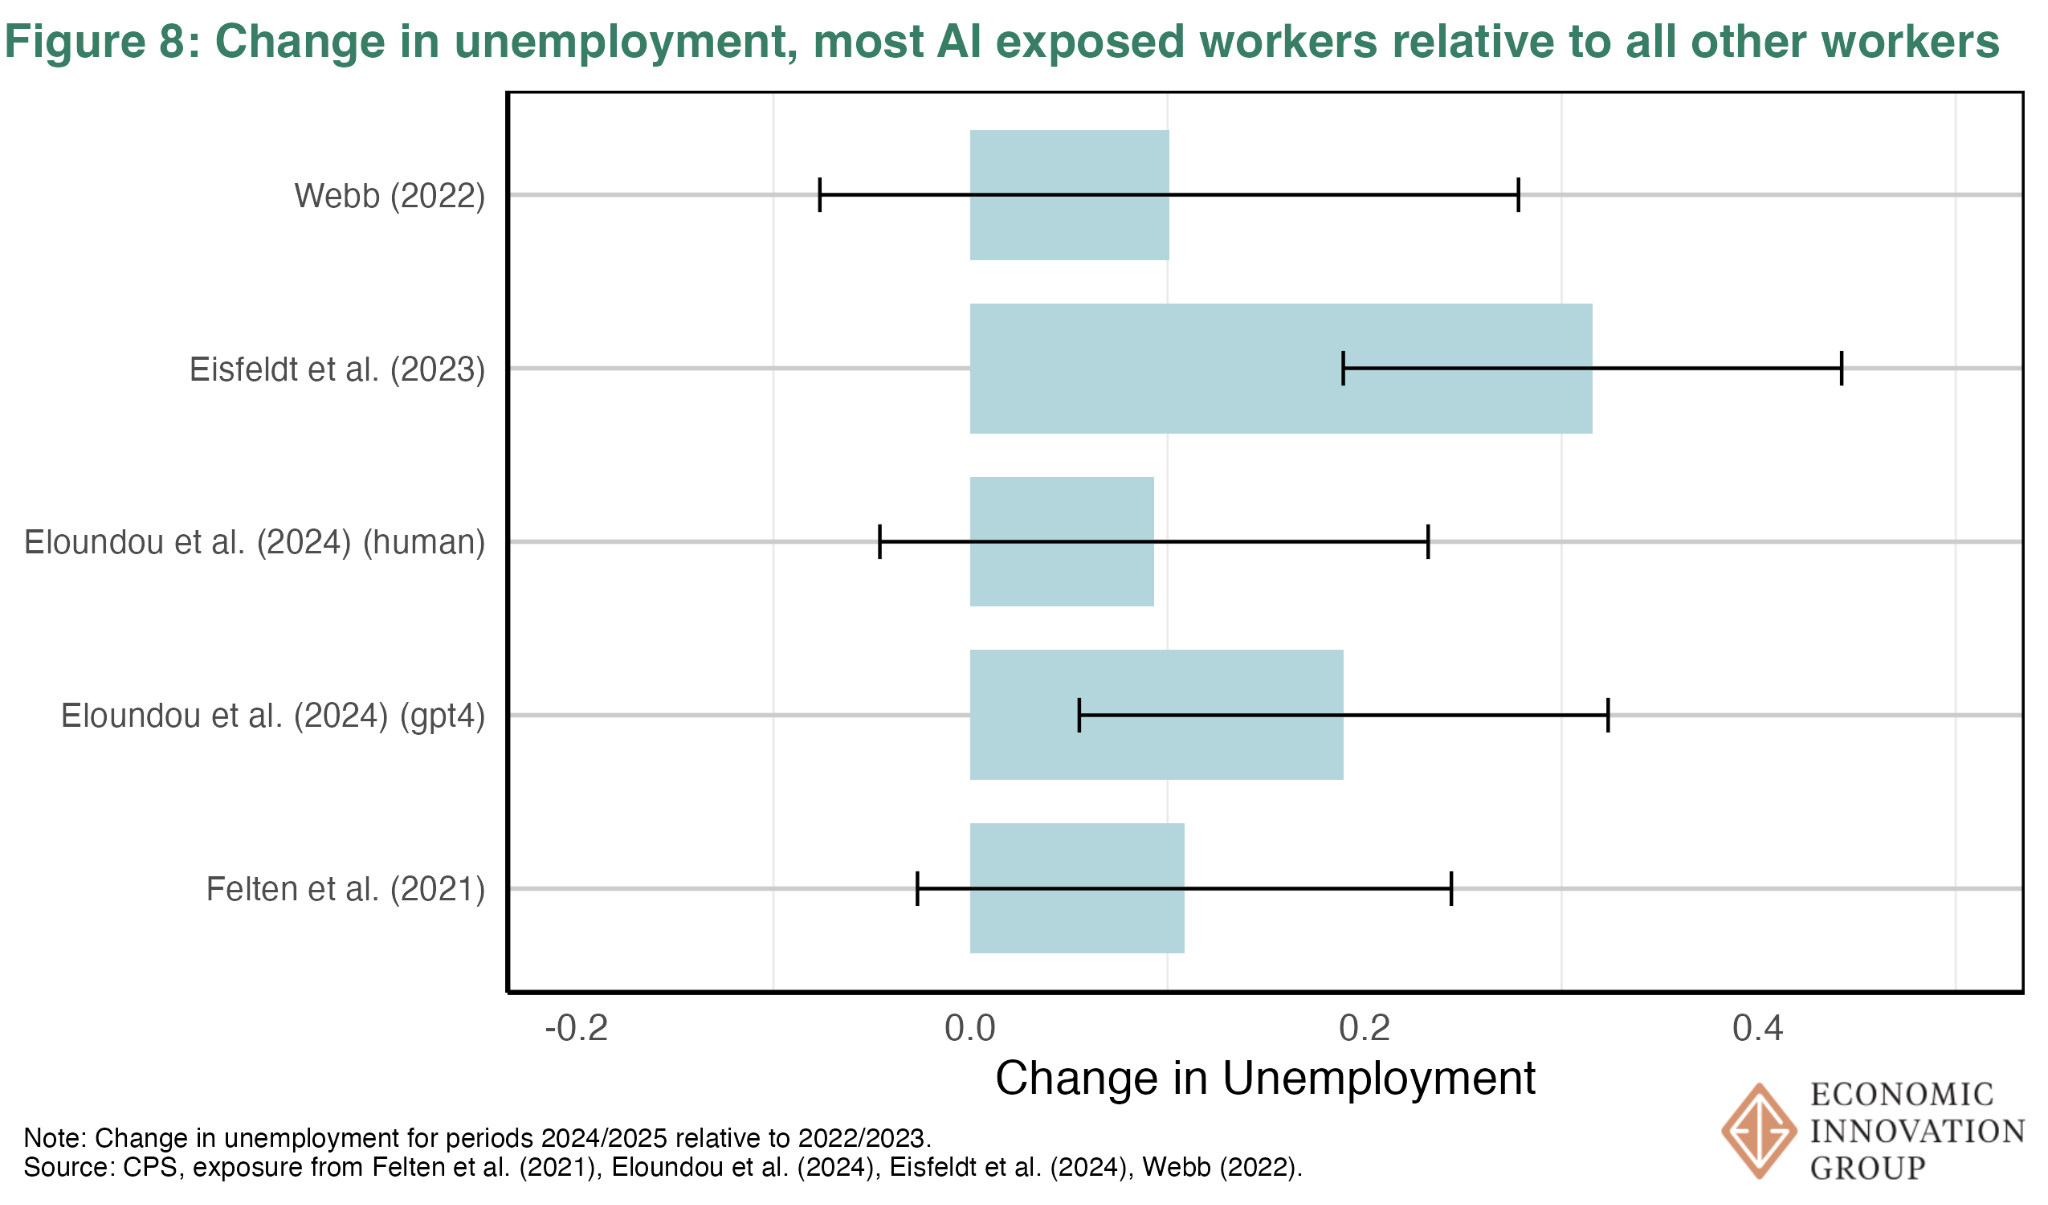
Having said that, we can detect a slight statistical difference in recent unemployment rates between AI-exposed and not using two of the measures. Figure 8 below shows the difference in unemployment rates between the most exposed and everyone else between the 2022-2023 and 2024-2025 periods.
The measure from scholars Tyna Eloundou, Sam Manning, Pamela Mishkin, and Daniel Rock — labeled “Eloundou et al. (2024) (gpt-4)” in Figure 8— shows about a 0.2 percentage point increase in unemployment (relative to the less exposed workers).
The measure from Andrea Eisfeldt, Gregor Schuber, and Miao Ben Zhang — “Eisfeldt et al. (2023)” — shows about a 0.3 percentage point increase (relative to the less exposed workers).
Ironically, these are two measures that use large language models to assess AI exposure. So perhaps, if we squint, AI is telling us that AI is increasing unemployment. But the differences found by these two measures are really quite small.
Finally, it’s important to again emphasize the point about causality. In truth, by merely looking for any visual sign of AI effects in our analyses, we set the bar quite low — and yet even that low bar was not cleared.
Even if it had been cleared, the most we would have been able to say is that highly AI-exposed workers were experiencing the labor market differently than other workers. But there might have been other reasons besides AI for that to be the case.
Remember that AI-exposed workers are very different from other workers. They tend to have higher education, lower unemployment rates, and higher wages. It could be that those characteristics — or any other — drive differences in employment trends rather than AI.
Occam’s Razor?
We don’t see the effects because they have not materialized — at least not yet. Official statistics on AI diffusion, as noted already, tend to be lower than popular discussion might lead you to believe.
We also know, from firm-level surveys, that the vast majority of firms (roughly 95 percent) report that AI had no net impact on their employment, and about the same number said it led to an increase in employment as said it reduced employment.
When firms were asked how they expect their employment to change 6 months into the future based on AI use, roughly 6.5 percent expected an increase and 6.1 percent expected a decrease.
Ultimately, in the short and medium term, AI may end up having a bigger impact on tasks than on employment. About 27 percent of AI-using firms reported that they used AI to replace worker tasks.
Even if AI isn’t totally reordering the labor market today, it may yet have a different kind of big effect: reorganizing how workers spend their time.
Appendix
A1. Defining AI Exposure
The academic literature has produced several measures of worker exposure to AI. Typically, these measures start by analyzing worker tasks, identifying tasks that are “exposed” to AI (which can mean multiple things) and then rolling those tasks up to occupations.
Once exposure is defined at the occupation-level, you can take that measure into worker-level data and, through industry-occupation matrices, to industries. Below we describe several of the AI exposure measures we’ve collected for this piece.
I. The first AI measure we consider, and the primary one used in this piece, was produced by Felten et al. (2021). We chose this measure for several reasons. First, it provides ability-level exposure measures, which makes the crosswalking between occupation code schemes described below more accurate. Second, the authors provide industry-level exposure measures, which proved useful in the analyses above.
Their exposure measure is built on a subset of common applications of AI based on categories provided by the Electronic Frontier Foundation (EFF) AI Progress Measurement project.
EFF maintains statistics about the progress of AI across different applications. Felten et al. (2021) combine EFF data with data on workplace abilities from the Occupational Information Network (O*NET) database from the Department of Labor. The authors link EFF’s AI progress measures to O*NET data by surveying approximately 2,000 “gig” workers via Amazon’s Mechanical Turk (mTurk) web service. Each respondent was asked to consider how an AI application is related to each O*NET ability. This provides a measure of application-ability relatedness, which is then summed to create an ability-level exposure score.
Felten et al. (2021) then compute occupation-level exposure by summing ability-level AI exposure by ability weighed prevalence and importance as measured by O*NET, then scale it by the weighted sum of prevalence and importance of all abilities to obtain a relative exposure measure.
Once at the occupation level, the authors use industry-occupation matrices to measure industry-level exposure, which they combine with county-industry data to measure geographic AI exposure.
Importantly, this measure is agnostic as to whether AI is a complement or substitute to workers, meaning that higher exposure could indicate increased productivity or a higher risk of job displacement.
II. The second AI measure we consider was developed by Eloundou et al. (2024). The authors use a rubric to determine whether a specific task is exposed to AI. That rubric classifies tasks based upon whether generative AI would reduce the time required for a human to perform a specific task.
Tasks are placed in three groups: (E0) tasks with no or minimal time reduction, (E1) tasks that could be completed 50 percent faster with access to an LLM, and (E2) tasks where an LLM alone would not reduce the time to complete by 50 percent but additional software on top of an LLM could reduce the time to complete by at least half, or (E3) tasks could not be completed 50 percent faster but would be given access to an image generation system.
Eloundou et al. (2024) classify tasks into E0-3 in two ways. First, using human annotations, with the authors and experienced annotators that have experience using OpenAI’s LLMs. Second, using GPT-4 to classify tasks. The authors construct several measures using different combinations of these classifications. We focus on the author’s preferred “beta” measure, which is the sum of tasks classified as E1 and 0.5 times the sum of tasks classified as E2 or E3, divided by the total number of tasks for an occupation. The 0.5 weight on (E2/E3) places less weight on tasks where complementary tools and investments are required. The authors note several weaknesses of their classification approach, but also find strong agreement between the human and GPT-4-based classifications.
The human-based classifications of Eloundou et al. (2024) are conceptually related to the Felten et al. (2021) measure, which also used surveys of humans to determine exposure. The GPT-4 measure, which uses AI to classify exposure to AI, is methodologically distinct from the Felten et al. (2021) measure.
III. Eisfeldt et al. (2023) study how firm-level exposure to generative AI impacts firm values. The authors estimate firm-level exposure to AI in two steps. First, using a process similar to Eloundou et al. (2024), the authors use Open AI’s GPT 3.5 Turbo to classify whether a task can be done by the current generative AI or by future instantiations of generative AI conditional on complementary investments (E0-E2 as in Eloundou et al. (2024)). The authors exclude E3 and compute exposure as the count of tasks classified as E1 plus 0.5 times the count of tasks classified as E2 divided by the total number of tasks.
There are three primary differences between the AI exposure measures produced by Eisfeldt et al. (2023) and Eloundou et al. (2024). First, Eloundou et al. (2024) include image capability dependent automation (combining E2 and E3). Second, Eloundou et al. (2024) uses ChatGPT-4 to perform the classifications while Eisfeldt et al. (2023) use GPT 3.5 Turbo. Finally, Eisfeldt et al. (2023) distinguish between core and supplementary tasks. The core task-based measure is meant to more accurately capture labor substitution, which would more likely generate unemployment effects. For this reason, we focus on the core-based measure in our analyses.
IV. The final AI exposure measure we consider was developed by Webb (2022). Webb (2022) uses text data from both patents and job descriptions to measure how much patenting in a particular technology has been directed at the tasks of a given occupation. Using verb-noun pairs, Webb (2022) quantifies the overlap between patents and tasks, aggregating the frequency of overlap at the task-level to the occupation-level. After validating the methodology with case studies focusing on robots and software, Webb (2022) creates an AI-exposure measure by focusing on AI patents and identifying the tasks, and in turn occupations, that have the most overlap with those patents. The Webb (2022) measure is methodologically distinct from the other measures because of its focus on patent documents. Advances in AI technology that overlap with worker tasks that are not mentioned in the patent corpus would not be captured by the Webb (2022) measure.
Unfortunately, with the exception of Webb (2022), these measures do not use an occupation coding scheme available in the CPS. To address this, we apply a series of crosswalks to translate each AI exposure measure’s native occupation scheme to occupation codes available in the CPS, which we describe in Appendix A2.
A2. Crosswalking
The Current Population Survey identifies occupations using the Census’s occupation coding system, while the AI exposure measures are based on either Standard Occupational Classification (SOC) codes, or David Dorn’s occupation code system.
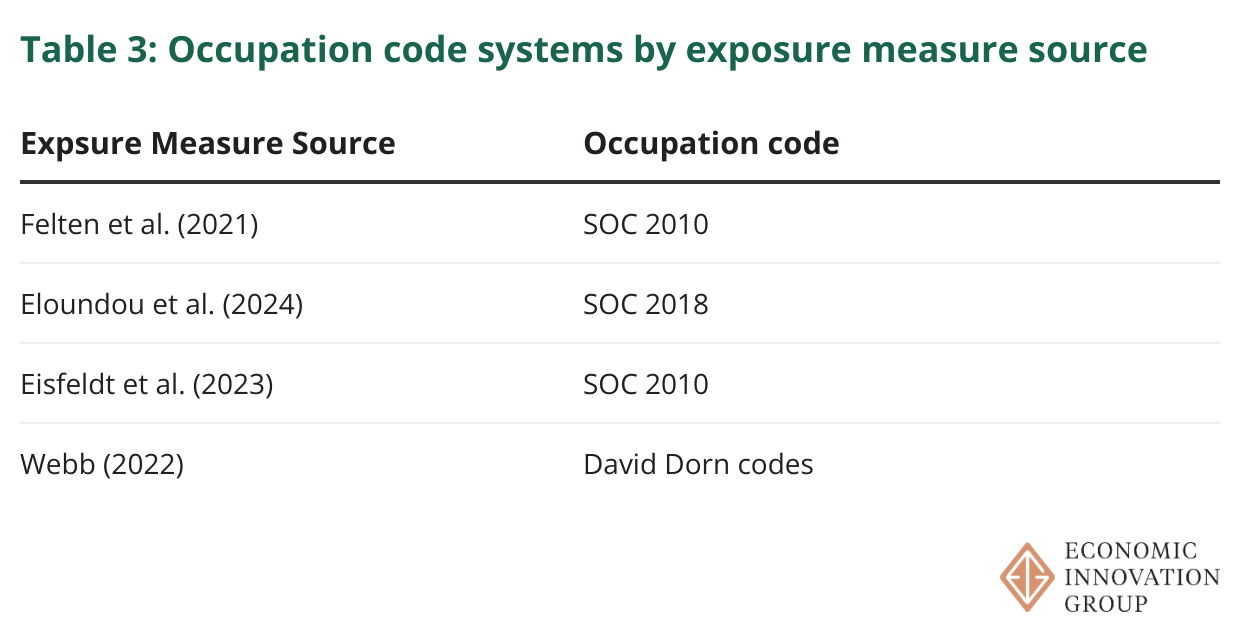
David Dorn’s codes are designed to be mapped onto the Census’s 1990 occupation code system, for which Dorn provides a crosswalk.[3] Using IPUMS’s OCC90 variable, which provides a harmonized 1990 occupation code for all respondents regardless of survey year, Webb (2022) exposure measures can be mapped directly onto our CPS sample from IPUMS.
In addition to occupation, industry, and geographic exposure, Felten et al. (2021) provide an ability-level exposure measure. This ability-level exposure eases the translation between occupation coding schemes. We directly translate Felten et al. (2021)’s measure onto the most current 2018-based Census occupation codes by crosswalking O*NET 2018 SOC codes to Census 2018 codes using Census’s many-to-many official crosswalk, then weighing ability-level exposure using O*NET’s importance weights at the occupation level.
SOC-to-Census Crosswalks: Approach 1
For the Eisfeldt et al. (2023) and Eloundou et al. (2024) measures, we explore two approaches to translating from their native SOC schemes to Census 2018 occupation codes. Our first approach uses the SOC 2018 to Census 2018 official crosswalk[4] and computes the average exposure across all SOC 2018 codes that map to a given Census 2018 code. A similar process is used for translating SOC 2010 occupation measures to Census 2018 occupation measures.
SOC-to-Census Crosswalks: Approach 2
We explored an alternative approach to crosswalking SOC codes to Census 2018 codes. In this alternative approach, we disaggregate the SOC codes into O*NET tasks, carrying along the AI-exposure weights, and then re-aggregate to Census 2018 occupation codes using O*NET ability importance weights. The initial disaggregation creates a many-to-many relationship between AI-exposure measures and tasks because many occupations share tasks.
Since Felten et al. (2021) provide ability-level exposure scores, we can use that information to evaluate the two crosswalking approaches. We treat the ability-level Felten (2021) translation of SOC 2010 to Census 2018 occupation codes as “truth” and compare it to the Census 2018 occupation-level exposure measures resulting from both Approach 1 and Approach 2. We find that the measures reliant on occupation-to-occupation crosswalks, Approach 1, produces AI exposure measures most similar to the ability-weighted “truth” measure.
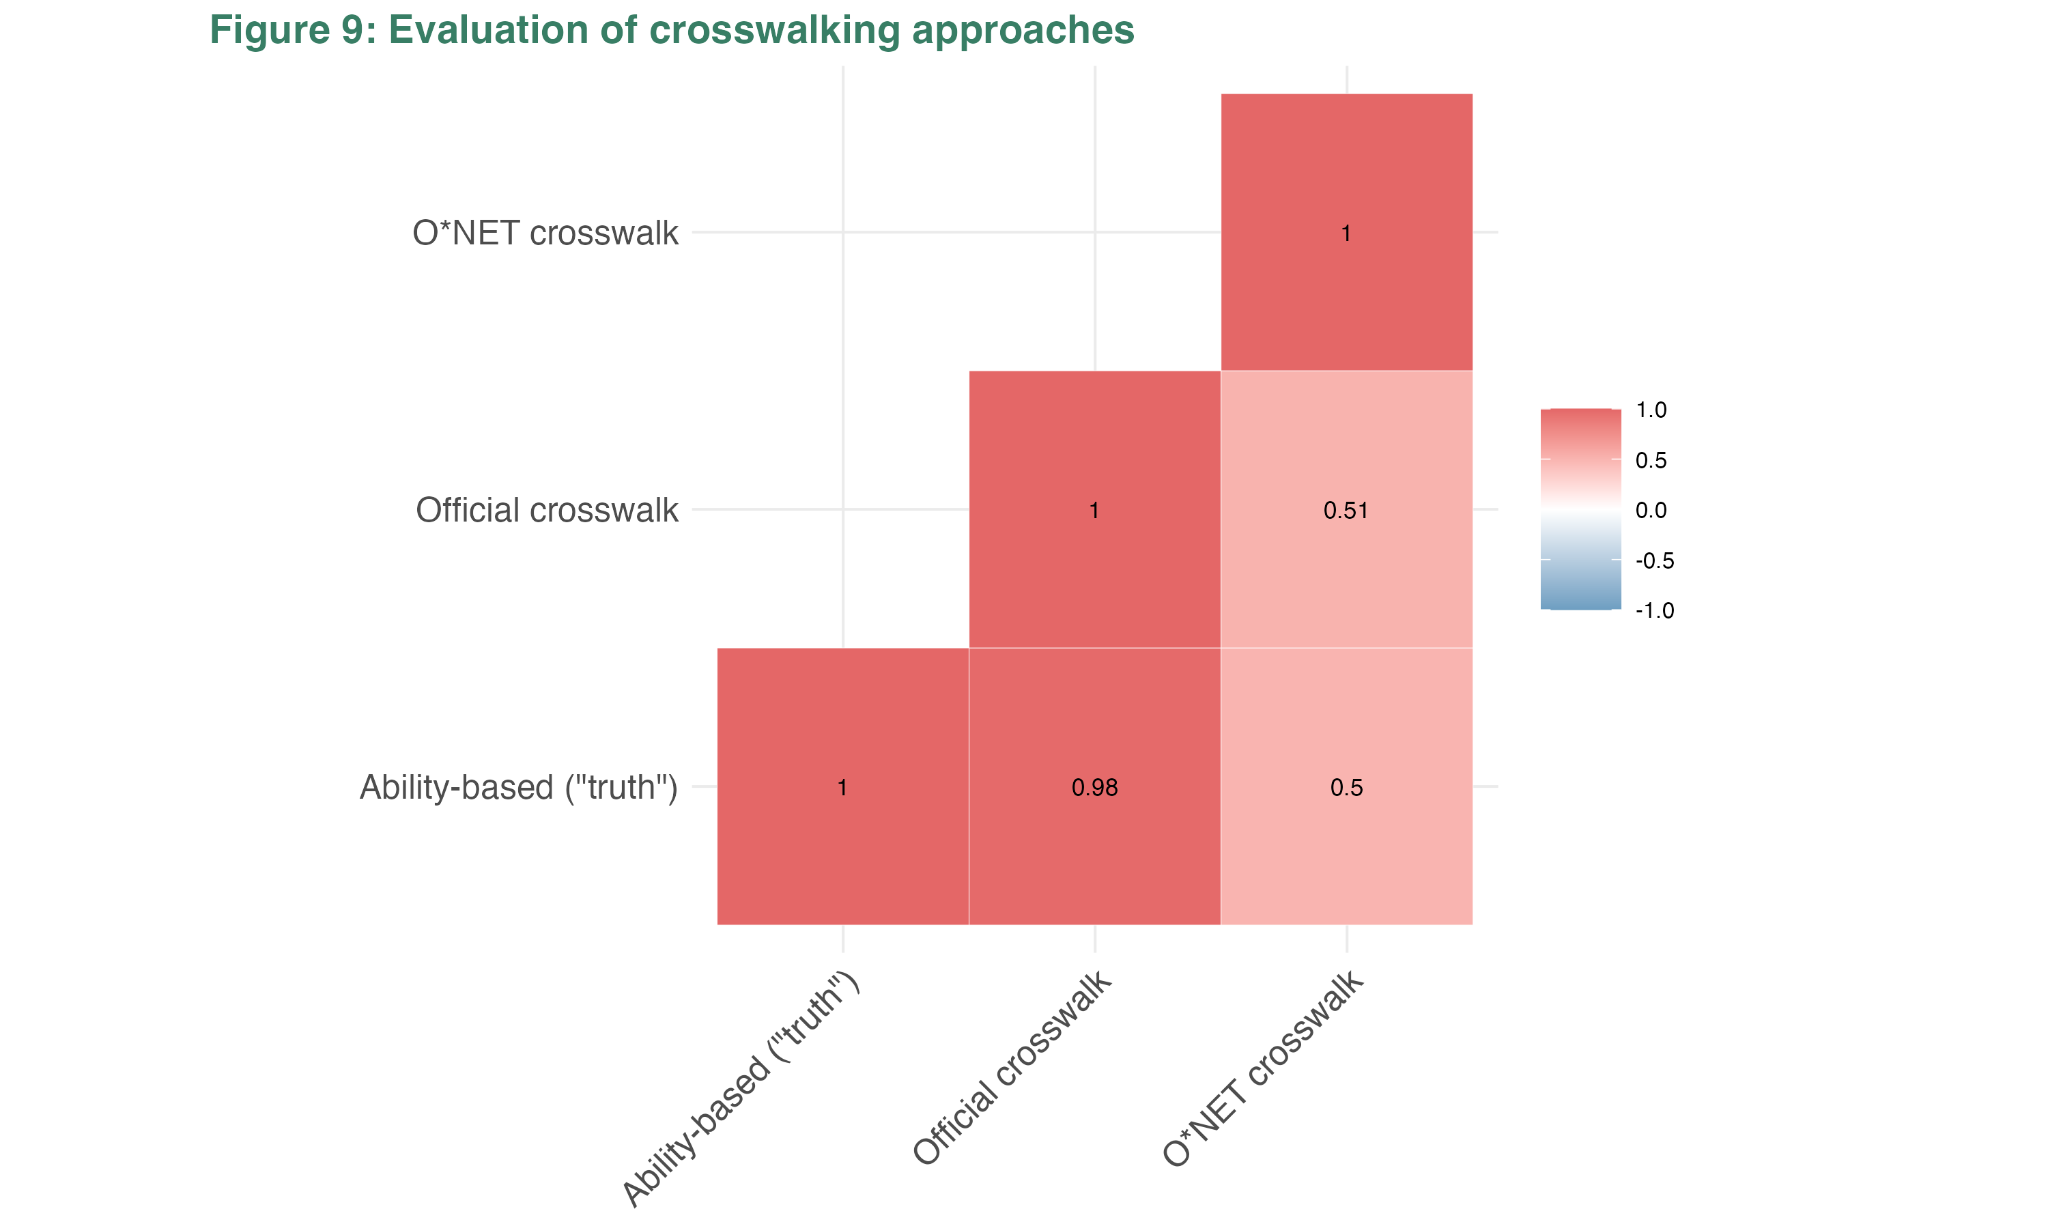
In all analyses using the Eisfeldt et al. (2023) and Eloundou et al. (2024) measures we rely on crosswalk Approach 1 to move from the native SOC occupation codes to Census 2018 occupation codes.
A3. Labor Market Outcomes and Alternative Measures of AI Exposure
Figure 10 shows the most AI-exposed (quintile 5) for each AI-exposure measure along with the unemployment rate for less exposed workers (dashed line).
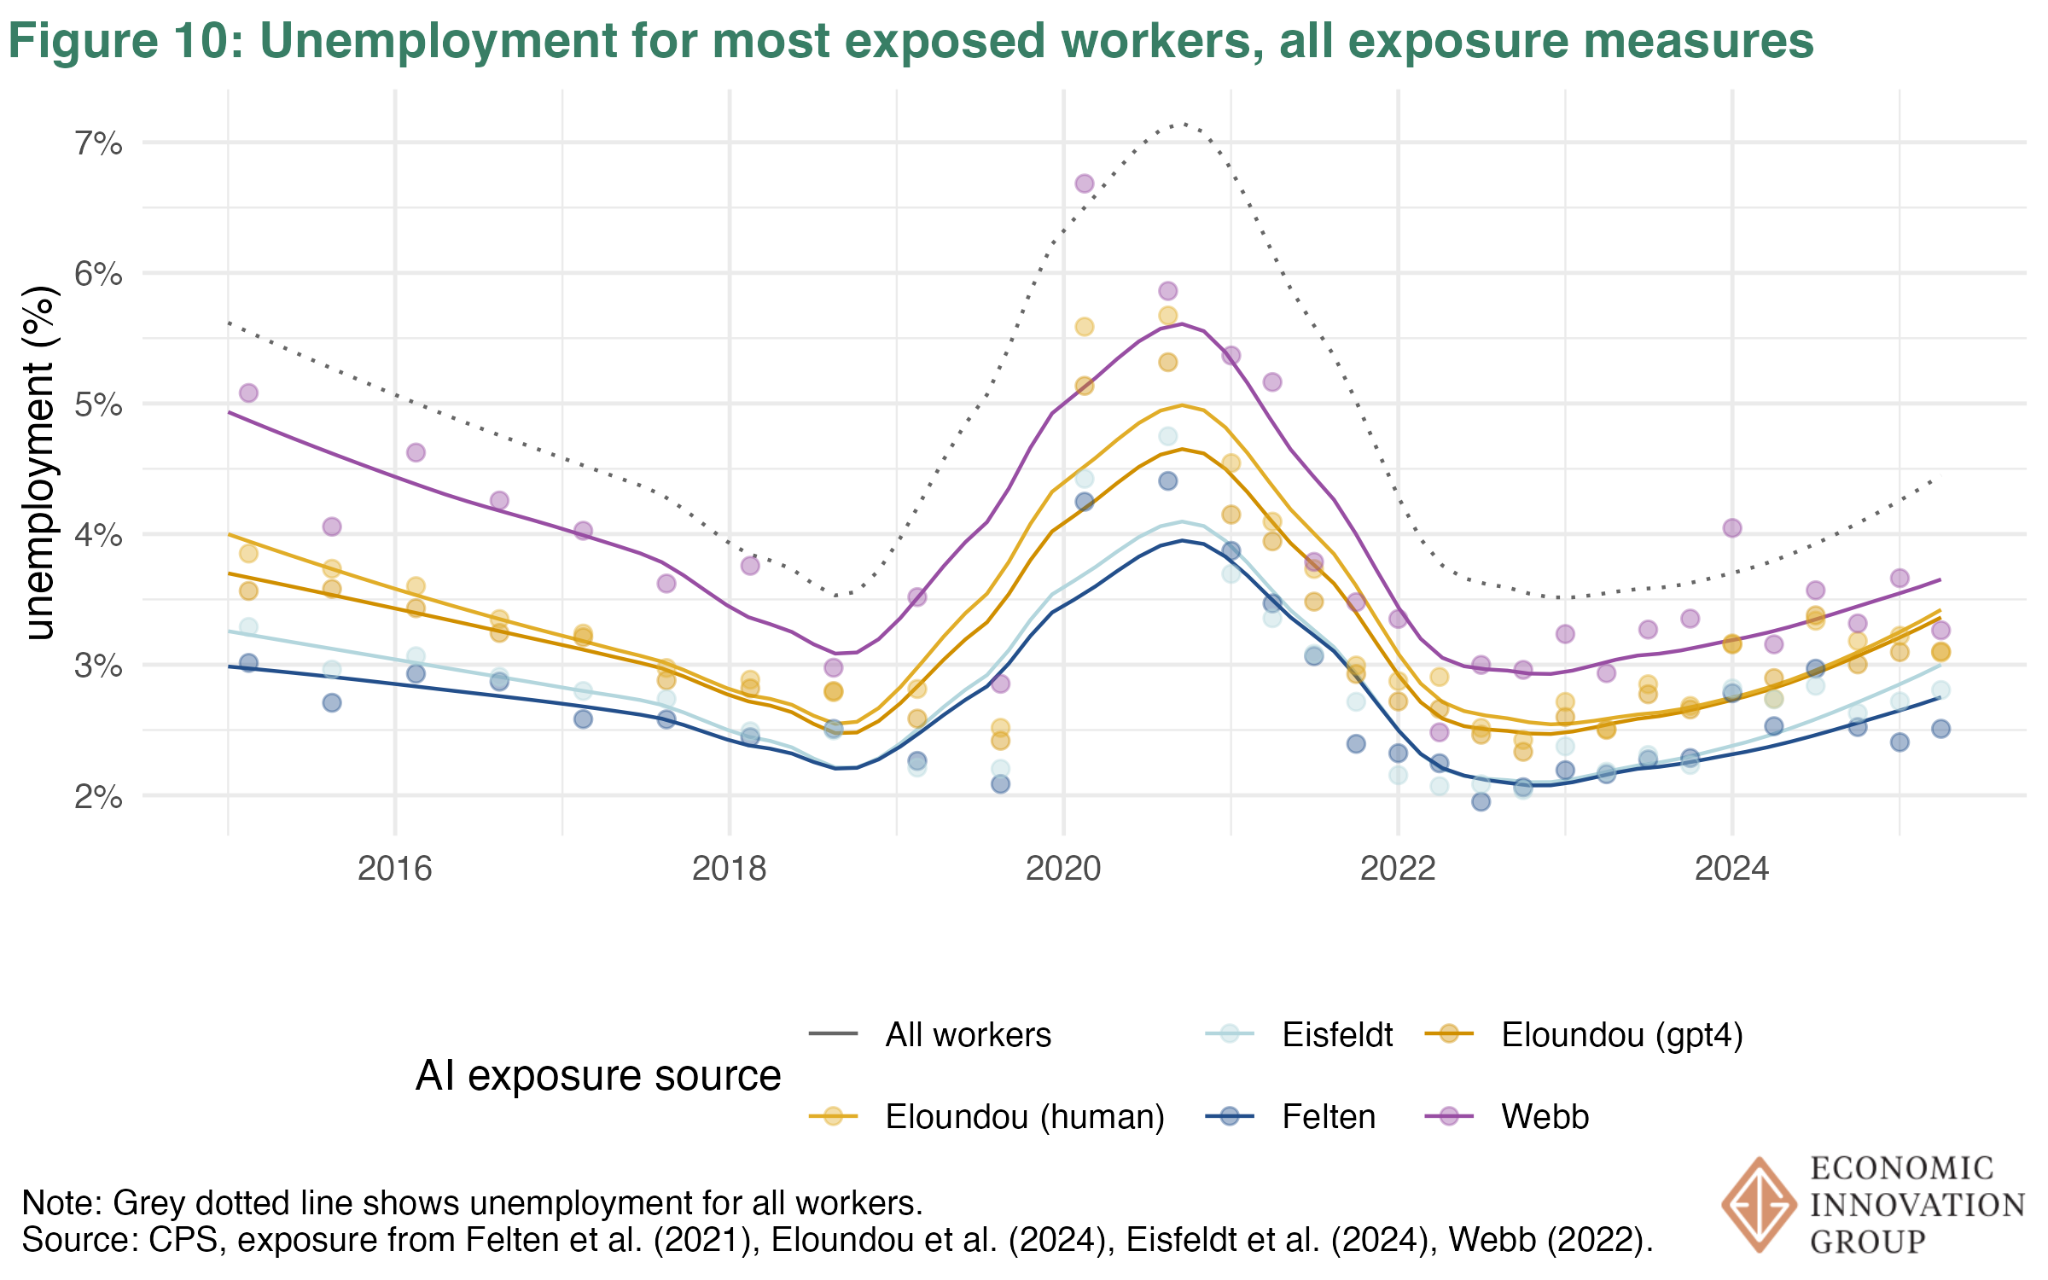
Figure 11 shows the probability of exiting the labor force for the most AI-exposed (quintile 5) for each AI-exposure measure along with the exit rate for less exposed workers (dashed line).
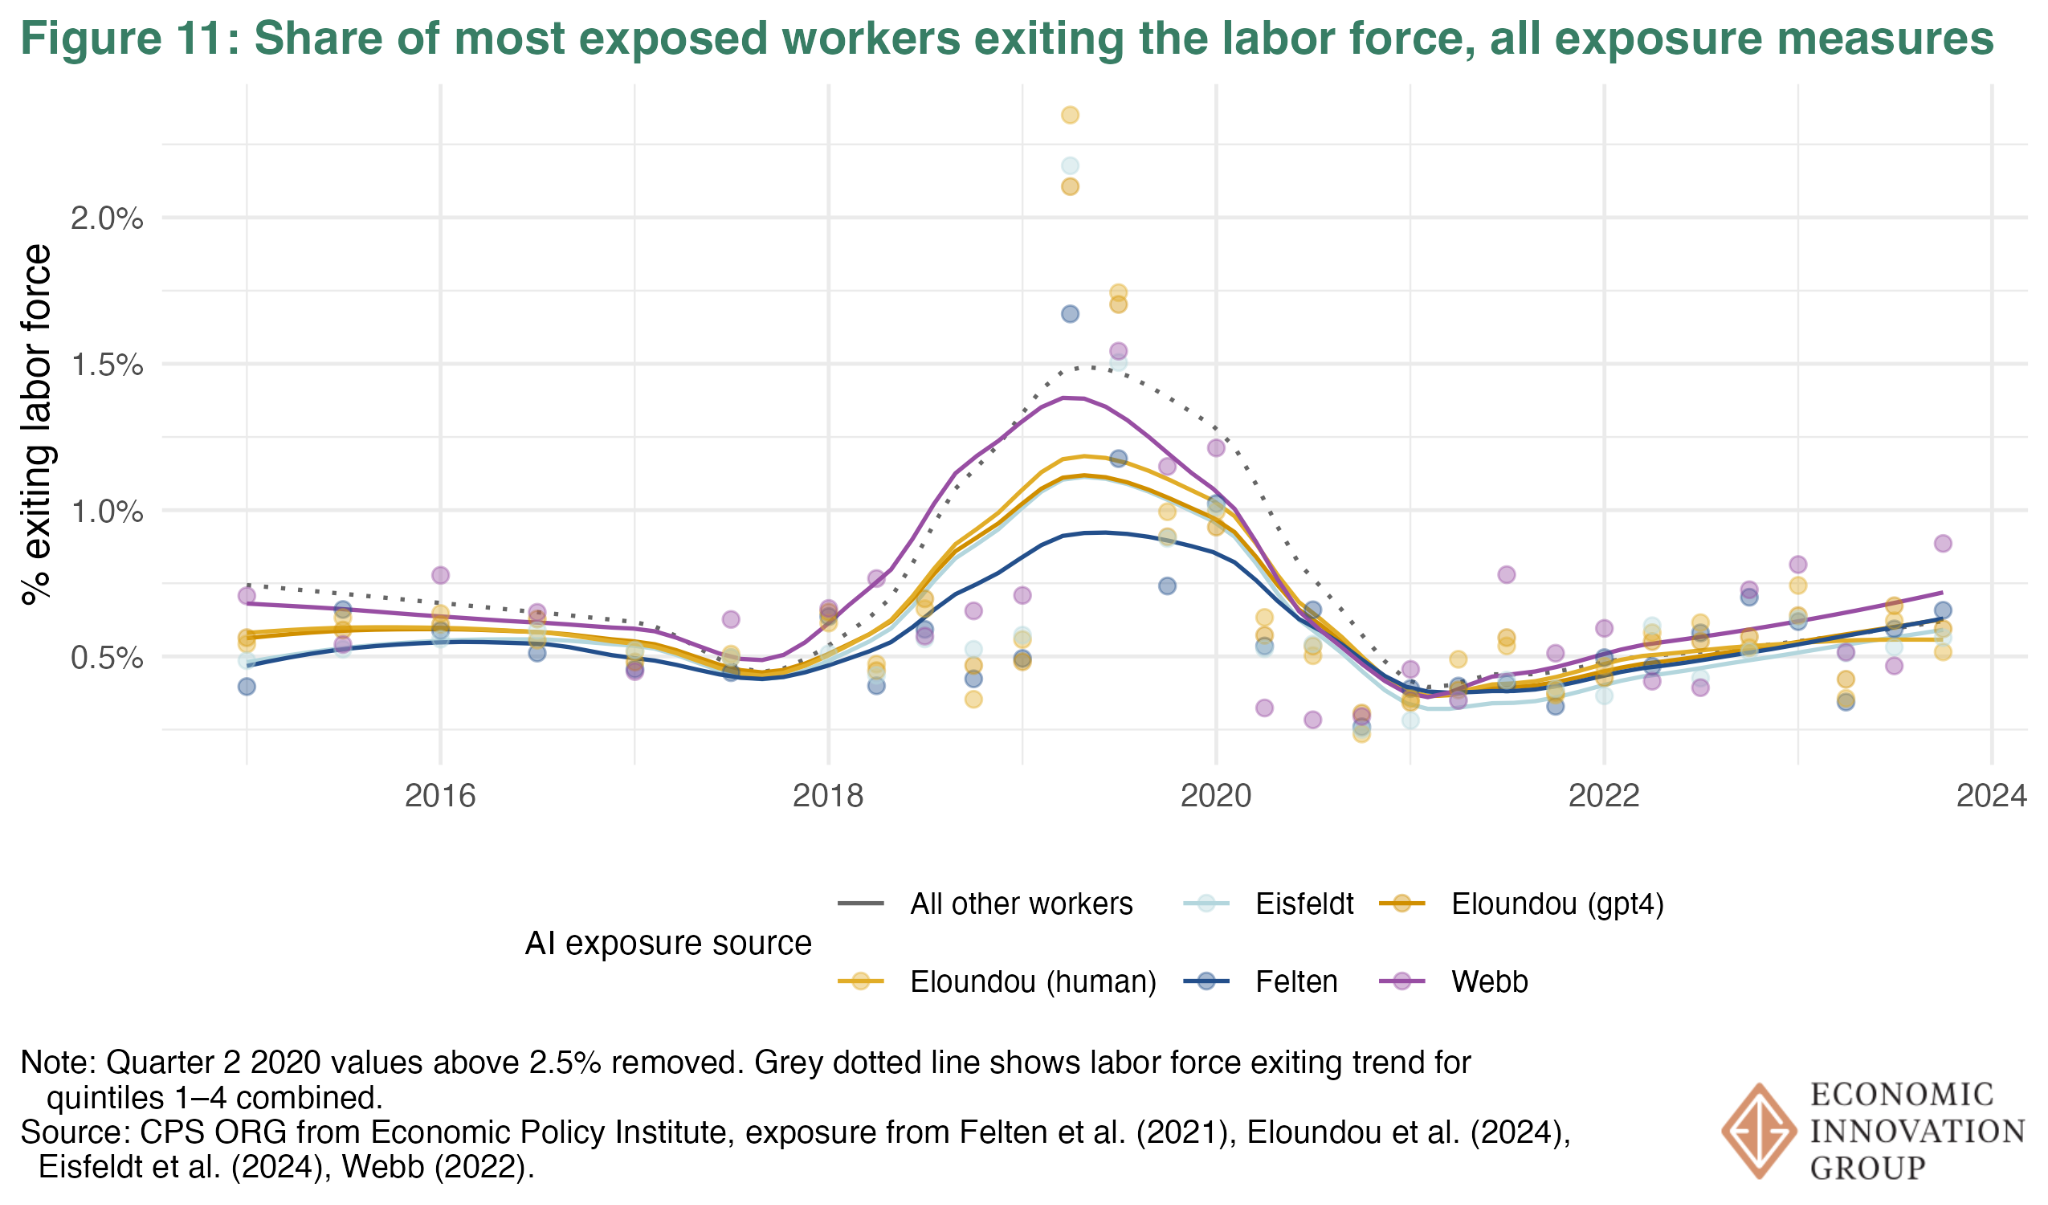
Figure 12 shows the probability of changing occupations for the most AI-exposed (quintile 5) for each AI-exposure measure along with the less exposed workers (dashed line).
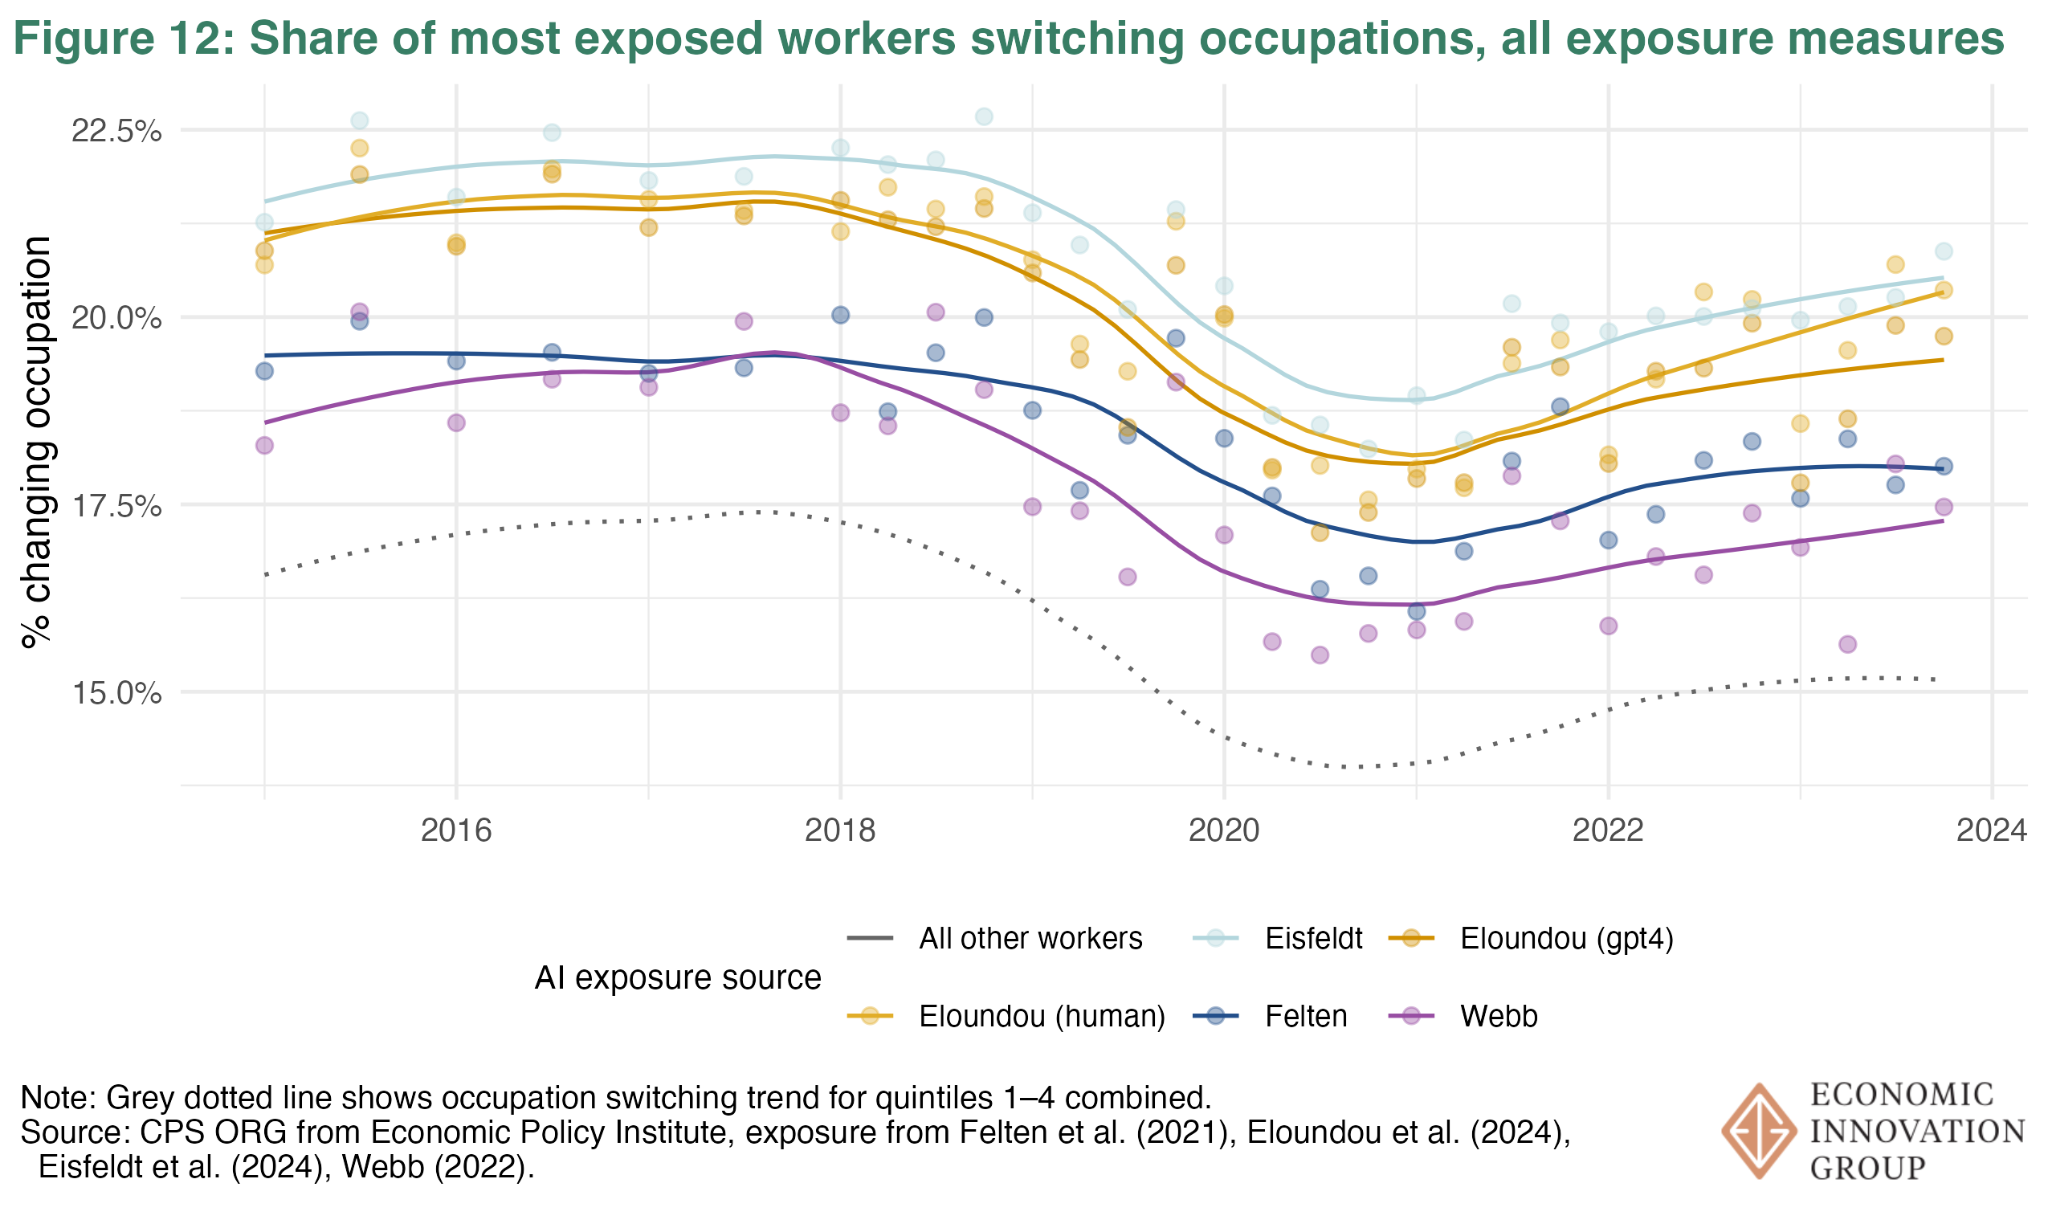
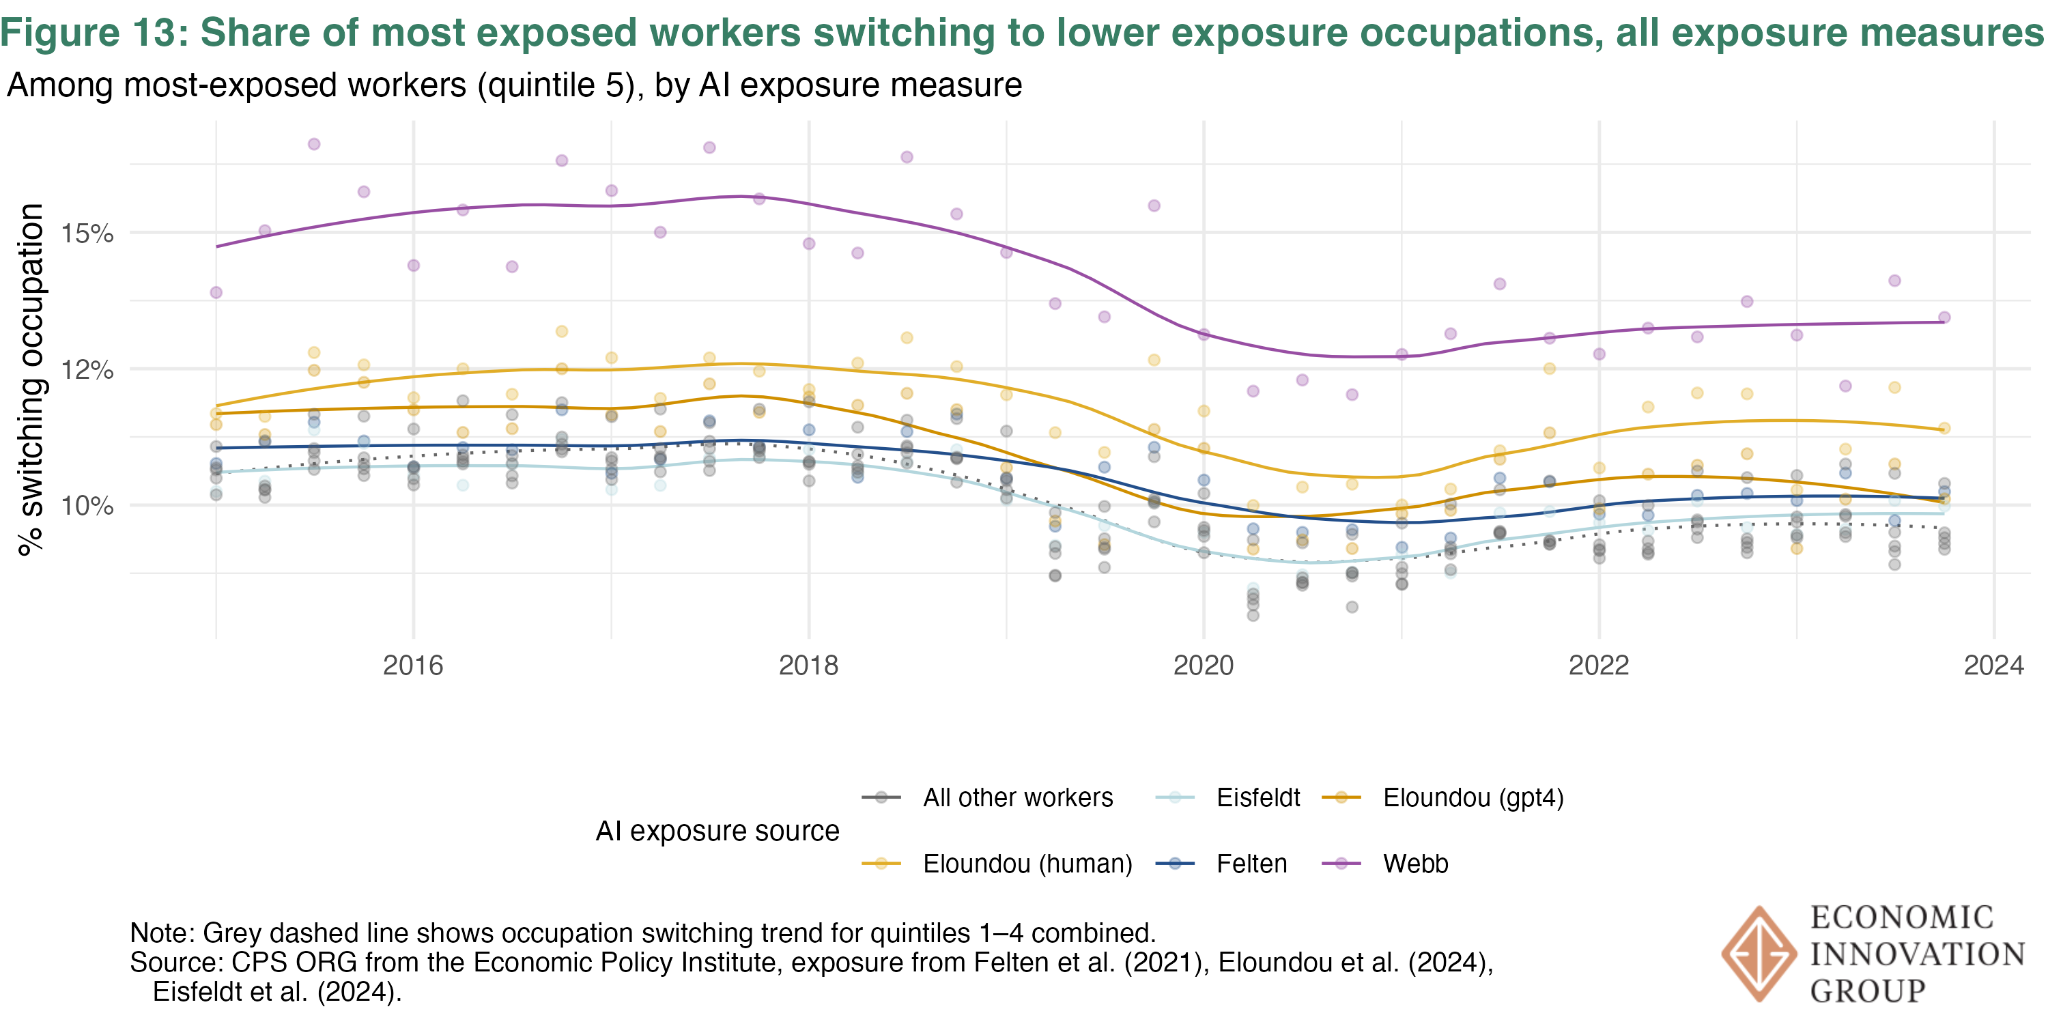
Figure 13 shows the probability of changing to a lower exposure occupation for the most AI-exposed (quintile 5) for each AI-exposure measure along with the less exposed workers (dashed line).
The industry-level analysis cannot be done directly with any of the exposure measures except Felten et al. (2021). One contribution of Felten et al. (2021) is the translation of occupation-based AI-exposure to NAICS industries.
A4. Additional Figures
Figure 14 shows the percent of businesses that report using AI in the prior two weeks.
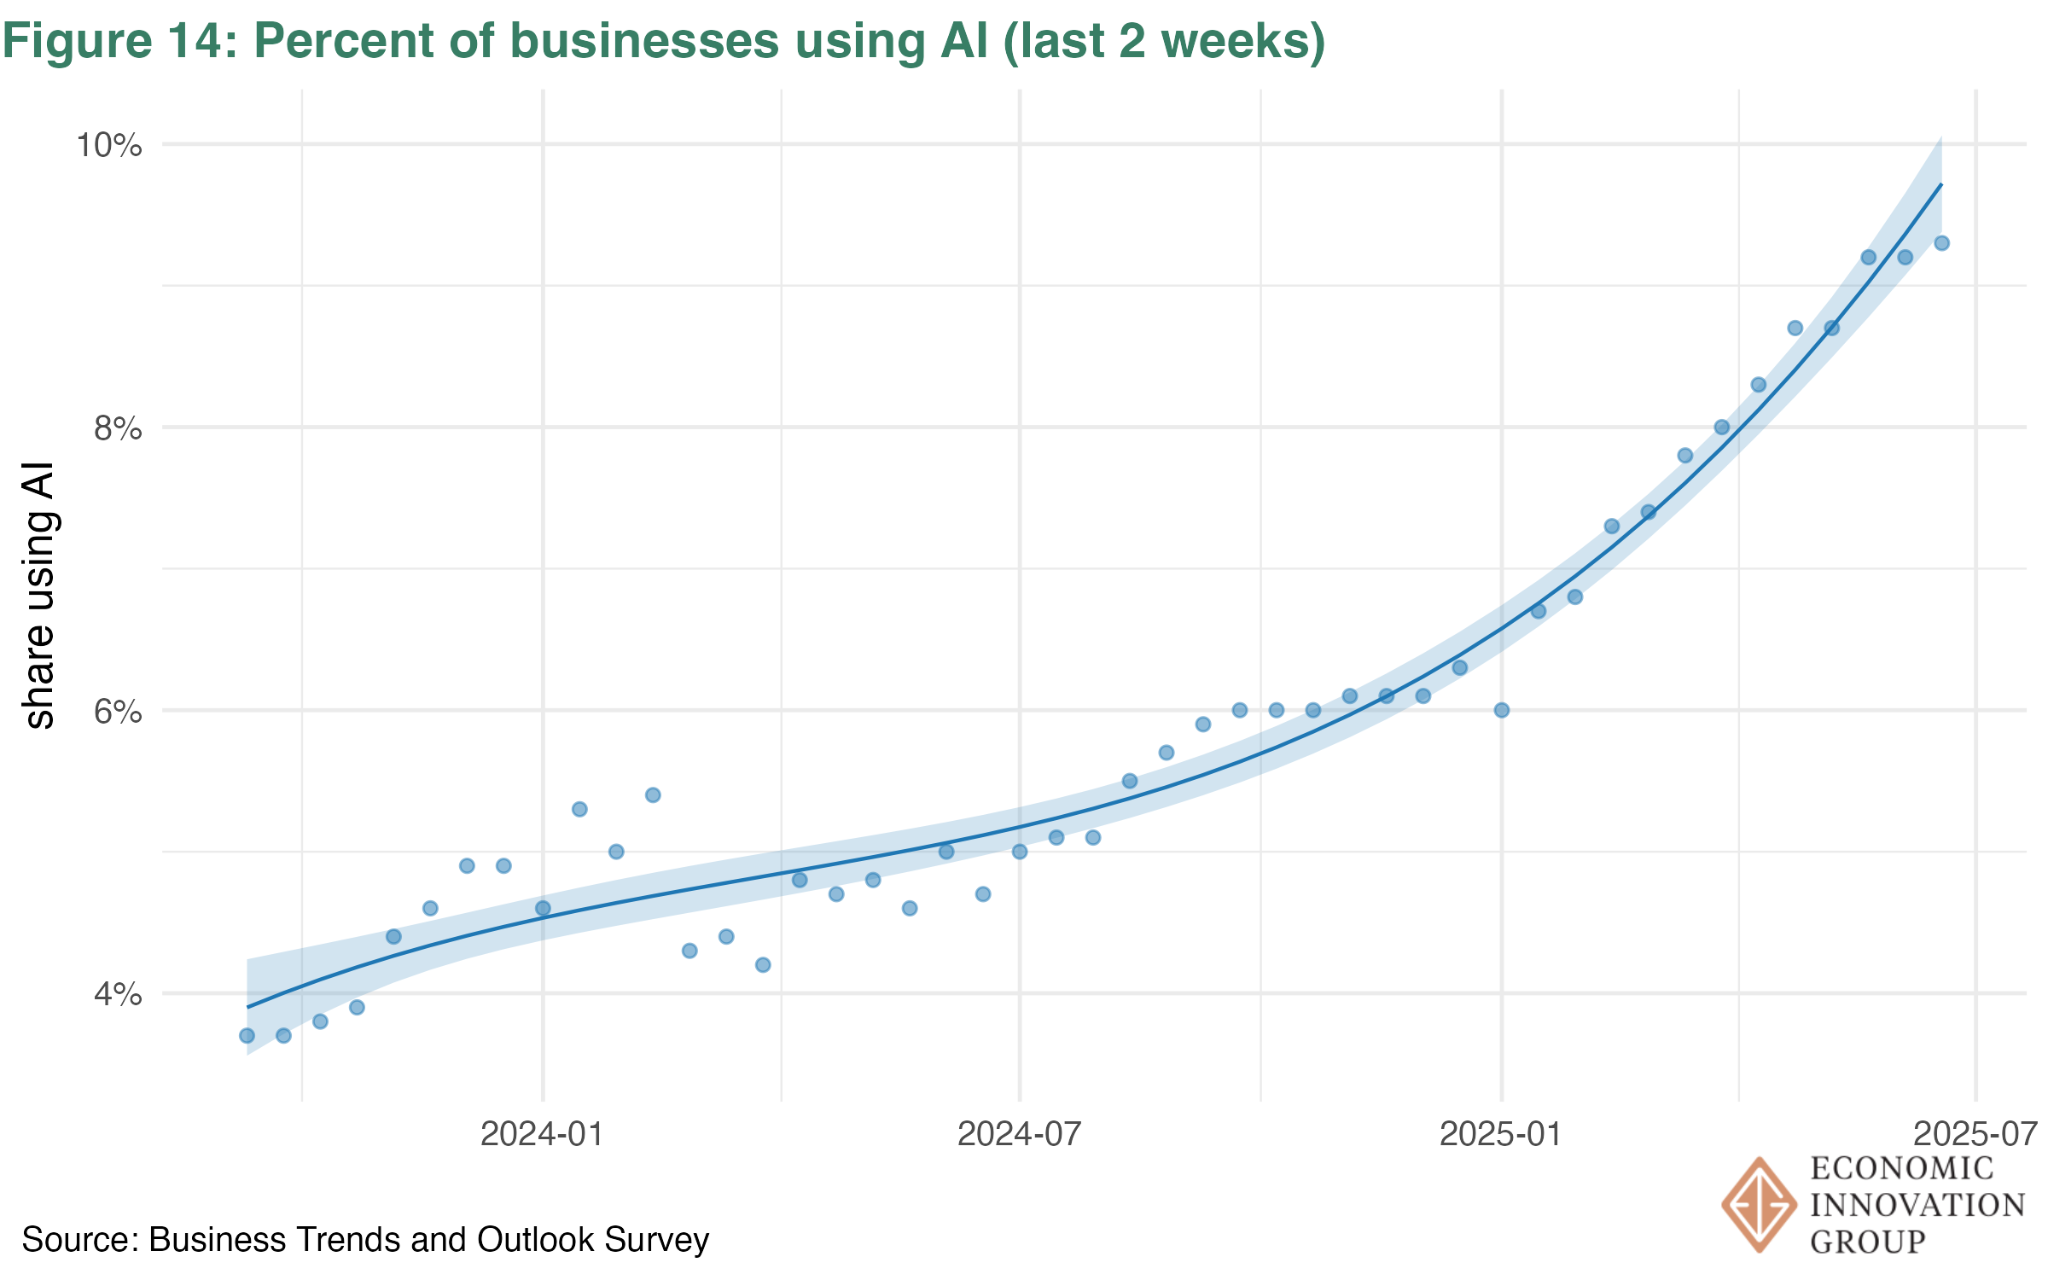
Figure 15 shows the percent of businesses that report using AI in the prior two weeks, and the percent that expect to use AI in the next six months, by major sector for the most recent period, June 18th 2025.
References
Eisfeldt, A. L., Schubert, G., & Zhang, M. B. (2023). Generative AI and firm values (No. w31222). National Bureau of Economic Research.
Eloundou, T., Manning, S., Mishkin, P., & Rock, D. (2024). GPTs are GPTs: Labor market impact potential of LLMs. Science, 384(6702), 1306-1308.
Felten, E., Raj, M., & Seamans, R. (2021). Occupational, industry, and geographic exposure to artificial intelligence: A novel dataset and its potential uses. Strategic Management Journal, 42(12), 2195-2217.
Webb, M. (2019). The impact of artificial intelligence on the labor market. Available at SSRN 3482150.
To see all the original data used in this analysis, please visit our Github repository.
Notes
- We calculate new entrants to be about 10% of the unemployed population (corroborated by others), but are unable to estimate their proportion of hires.[↩]
- The unemployed with no prior job are not assigned an occupation, effectively removing them from this chart. A negligible proportion (<1%) of workers ages 22-27 have not yet had a job. From the BLS documentation, “The occupational and industry classifications are based on a person’s sole or primary job, unless otherwise specified. For the unemployed, the occupation and industry are based on the last job held.”[↩]
- https://www.ddorn.net/data.htm[↩]
- https://www.census.gov/topics/employment/industry-occupation/guidance/code-lists.html[↩]