By August Benzow
Key Findings
In both 2016 and 2020 the lion’s share of rural counties1 picked Donald Trump as their president. Only 16 rural counties flipped from Trump in 2016 to Biden in 2020, and only 12 flipped from Clinton in 2016 to Trump in 2020.2 Although election results are still being tallied in some counties, Biden is on track to win roughly the same share of rural counties as Clinton, around 10 percent. This is far below the 17 percent of rural counties that Obama won in 2012. What are the characteristics of rural places that vote blue in a sea of red? EIG’s latest analysis shows that the success of Biden in certain rural areas was associated with factors such as:
- Demographics: In every region of the country except the Northeast, rural counties won by Biden tended to have larger non-white minority shares of the population than those won by Trump. In the South, rural counties won by Biden were two-thirds non-white on average.
- Economic distress: Rural counties in the South won by Biden had higher levels of economic distress than those won by Trump, but in the Northeast, rural counties won by Biden were much more prosperous than those won by Trump.
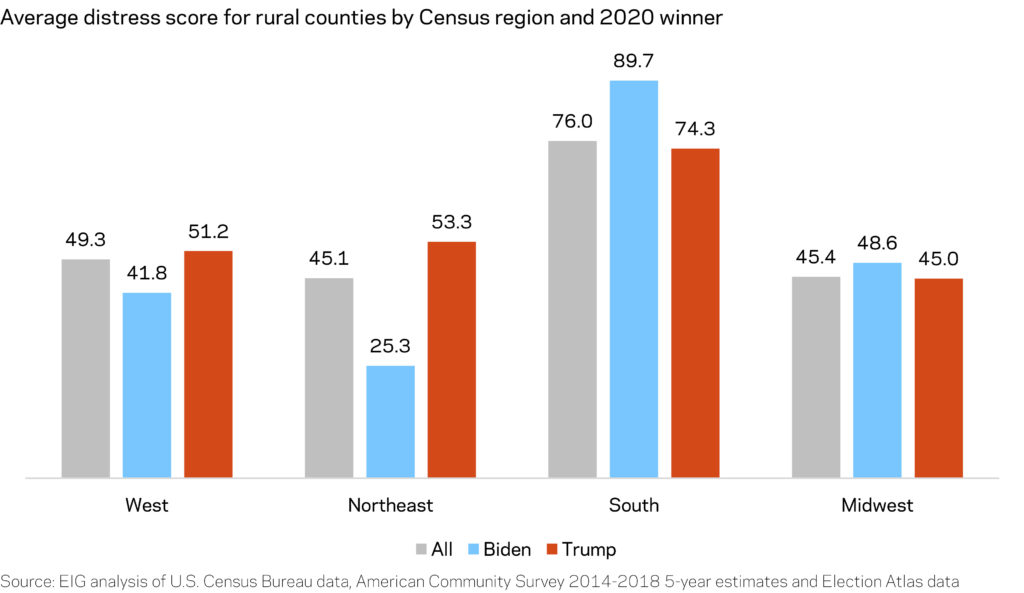
- Tourism and recreation: In the West, Biden did especially well in rural counties that had high shares of workers employed in the leisure and hospitality sector. On average, over one-quarter of workers in rural counties that Biden won in the West were employed in the leisure and hospitality sector.
- Migration: High-migration rural counties with an elevated share of the population made up of newcomers from out-of-state tended to go to Biden. This is especially true in the Northeast, where the average share of out-of-state movers in rural counties won by Biden is more than double the share in the region’s rural counties won by Trump, 3.5 percent compared to 1.6 percent.
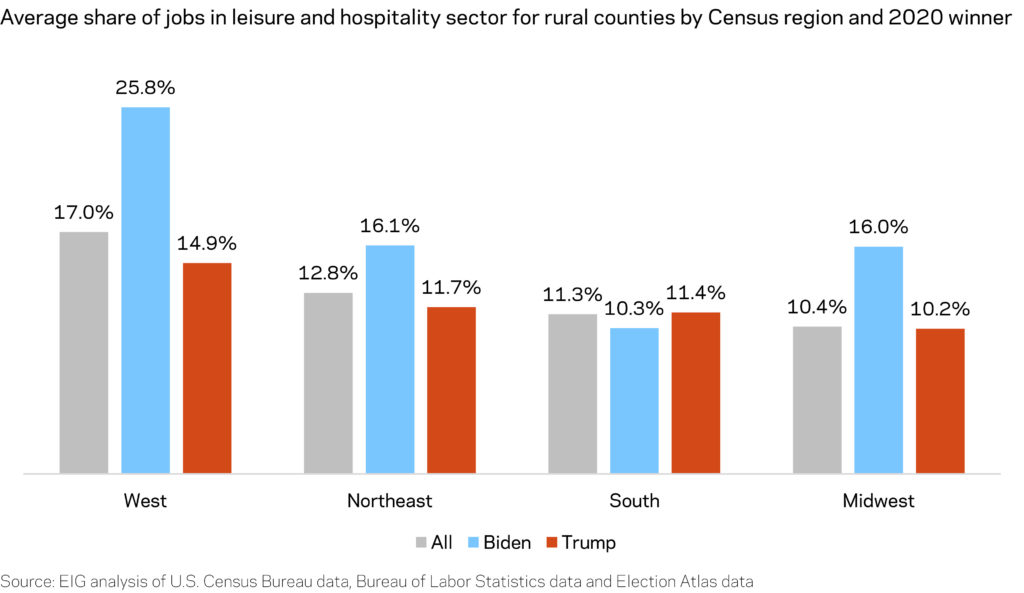
- Population growth: Rural counties won by Biden in the Midwest saw an average 1.8 percent growth in population, while rural Midwest counties that Trump won experienced a 2.5 percent average decline in population.
More diverse rural counties overwhelmingly went to Biden
Biden won a little more than half (50.5 percent) of rural majority-minority counties, slightly fewer than Hillary Clinton carried in 2016, largely due to the erosion of support among Hispanics in rural Texas. Trump won just three majority-Black rural counties, all of which had a sizable white population and fewer Black residents than the typical majority-Black county. In every region of the country, except the Northeast, rural counties won by Biden have higher average non-white shares than Trump rural counties, most notably in the South where rural counties won by Biden were on average two-thirds non-white.
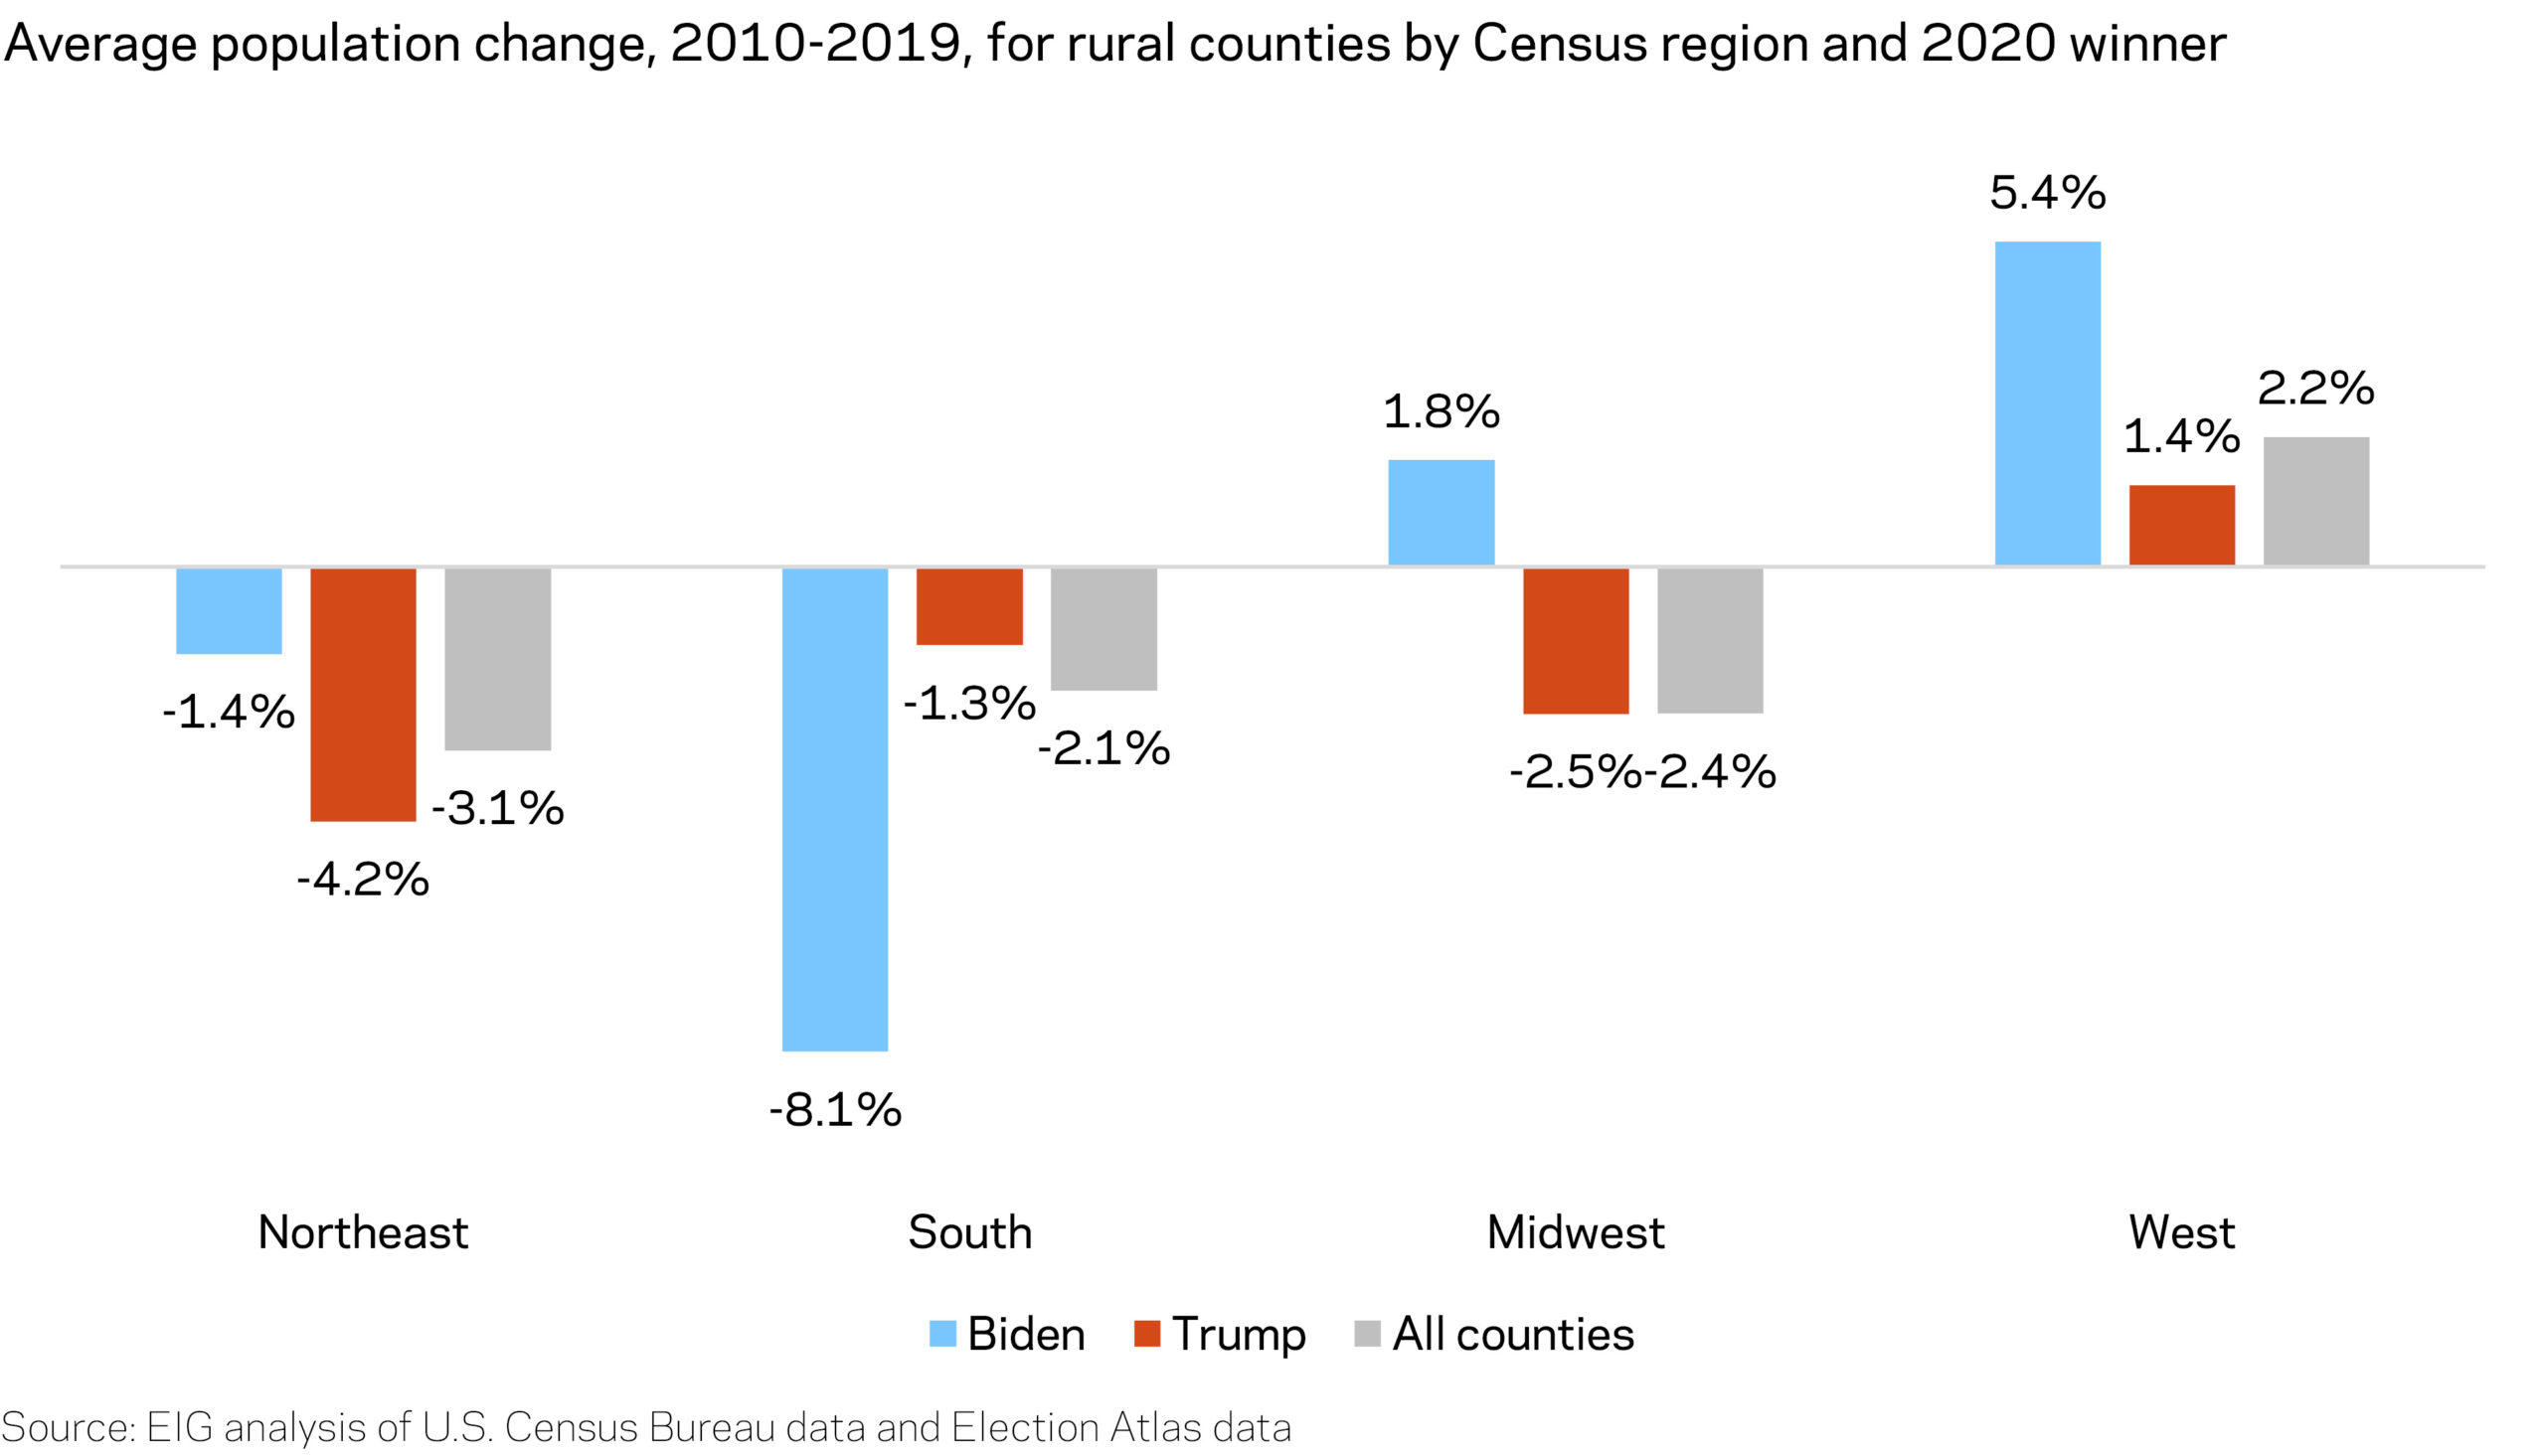
In parts of the West, racial and ethnic diversity in some rural counties have given Biden a significant edge. In Arizona, he saw landslide victories in Apache County, which is 73.1 percent Native American, and Santa Cruz County, which is 83.5 percent Hispanic. However, Biden saw very few wins across an almost continuous band of rural counties that stretch from interior Washington through Oregon and down to Nevada, among which there is only one majority-minority county.
Economic well-being is associated with different election results depending on a county’s demographics
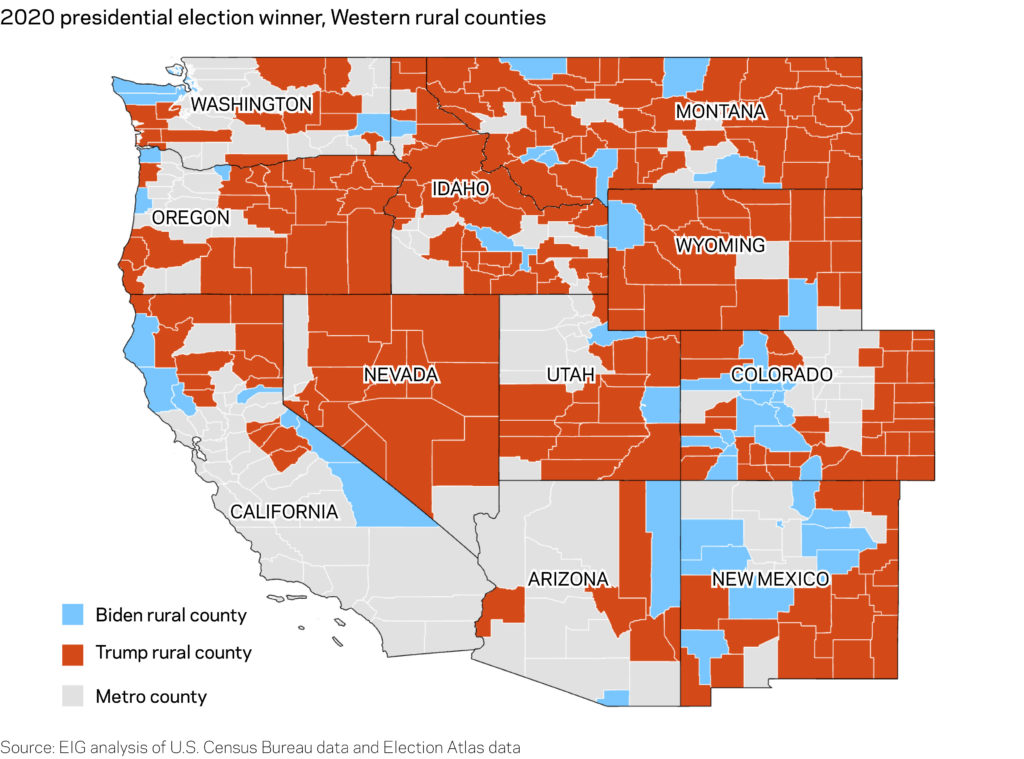
Economic distress is not a consistent indicator of the political leanings of a rural county. Using EIG’s recently updated Distressed Communities Index, where a higher distress score on a 100-point scale reflects a greater degree of economic distress, rural counties won by Biden were slightly more distressed than those won by Trump, a score of 65.3 compared to 58.6. But beneath this topline number there is significant regional variation. Rural counties won by Biden in the South, with its large number of majority-Black, distressed rural counties, had an average score of 89.7, compared to 74.3 for Trump counties. By contrast, in the Northeast, rural counties won by Biden had an average distress score of 25.3, compared to 53.3 for counties won by Trump.
Recreation-focused rural counties leaned towards Biden, especially in the West
The share of workers employed in the leisure and hospitality sector is a powerful predictor of whether a rural county leans Democrat versus Republican. On average, over one-quarter of workers in rural counties that Biden won in the West were employed in the leisure and hospitality sector, compared to 14.9 percent for those won by Trump. A similar pattern is seen in the Midwest and the Northeast, but the relationship largely disappears in the rural South.
In deep red Wyoming, for example, Biden won Teton County by a landslide, a rural county where 43.9 percent of the population is employed in leisure and hospitality. Similarly, the eight rural counties that Biden won in Washington and Oregon, were for the most part coastal rural counties with an especially high share of workers employed in leisure and hospitality, 22 percent on average. By comparison, in rural counties that Trump won in these two states, leisure and hospitality only accounted for 12.4 percent of employment.
In-migration helped tip the political scales to Biden in many rural areas
Counties that Biden won in the West and Northeast are oftentimes counties that have seen above average population inflow. Population inflow is measured here as the share of a county’s population that consists of movers from out of state or abroad within the last year. This metric is especially relevant in the Northeast, where interstate migration is facilitated by the small size of the region’s states, and in the West where recreation-focused rural counties attract out-of-staters. Variations of this trend also play out amidst the vast sea of largely homogenous rural counties in the Midwest. In the South, where sprawling metropolitan areas are the in-migration magnets, rural counties typically face stagnant or declining population trends regardless of their political leanings.
The share of population that represents out-of-state movers in rural Northeast counties that Biden won is more than double the average share in the region’s counties won by Trump, 3.5 percent compared to 1.6 percent. In the West, rural counties won by Biden have a slightly higher out-of-state population share compared to counties won by Trump, while there is no difference by election winner in the Midwest or the South.
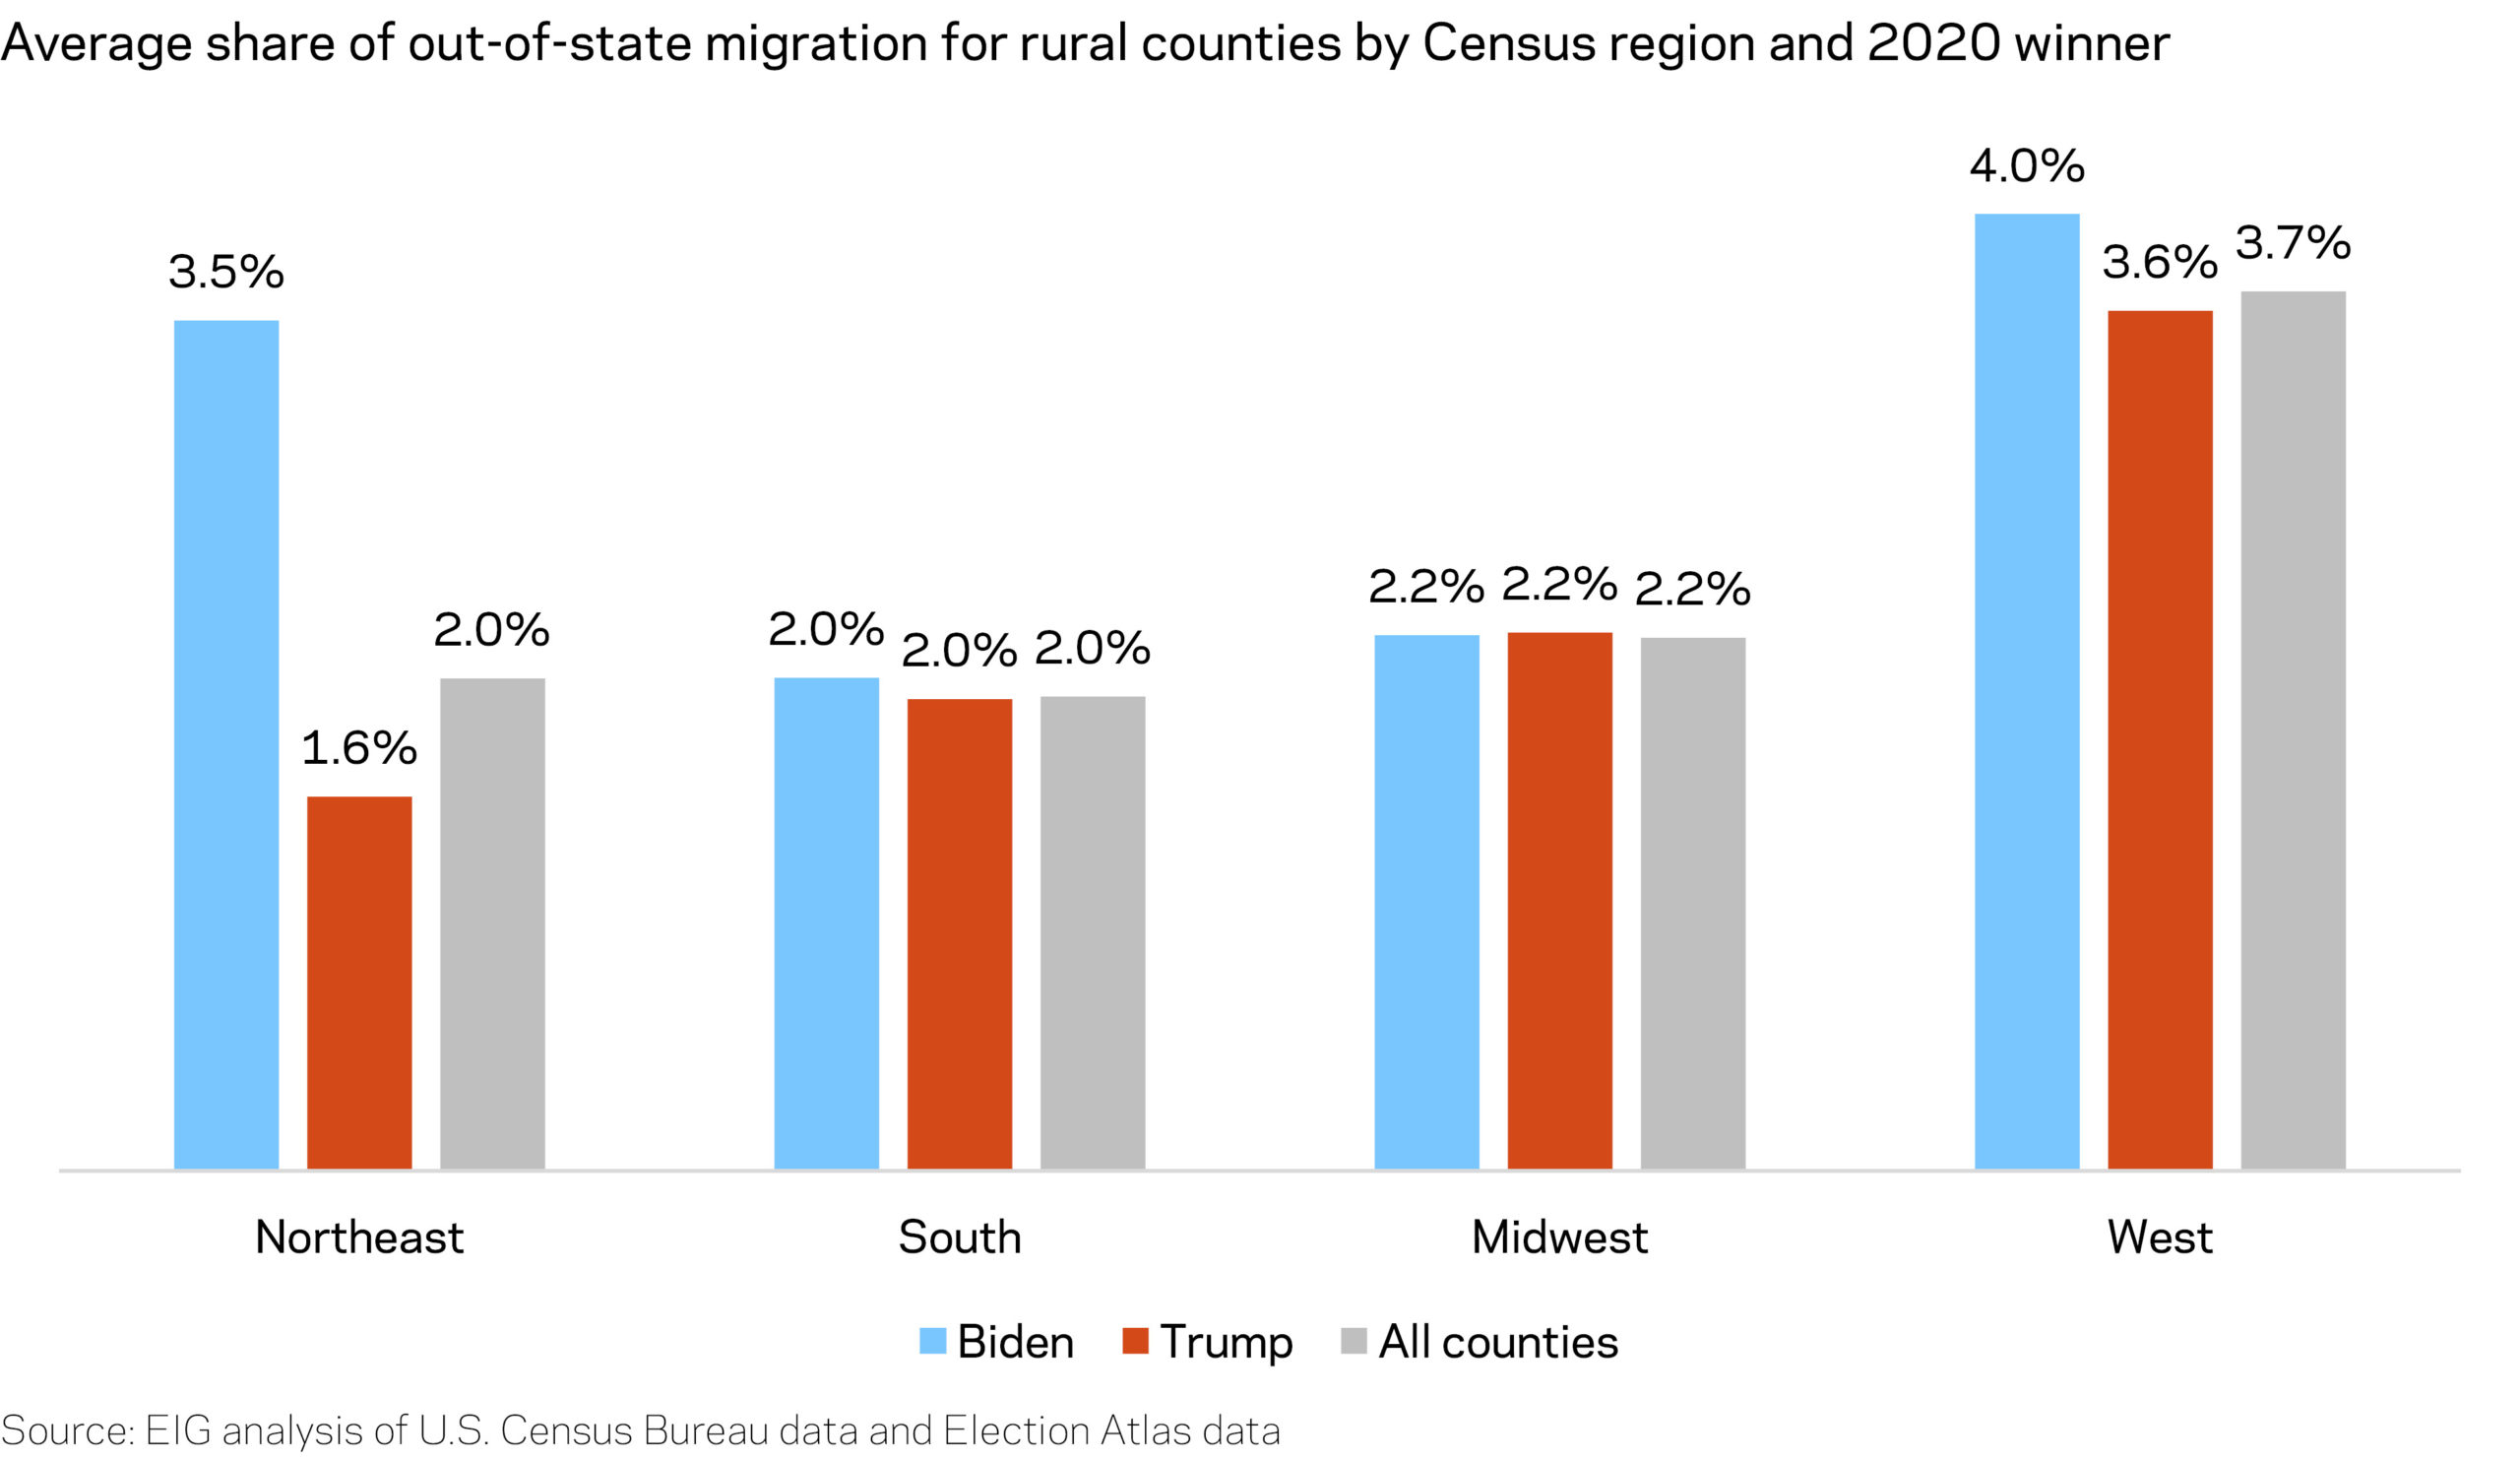
In California, Biden’s seven rural counties had an average out-of-state migration share of 3.2 percent, compared to 1.7 percent across the 14 rural counties won by Trump. In New Hampshire, those numbers were 2.7 percent for Trump and 4.1 percent for Biden. And in Idaho, the three counties that Biden won had an average 6.9 percent out-of-state population share, compared to 4.7 percent for Trump.
Across all regions, rural counties won by Biden had a higher share of newcomers from “blue” counties that voted for the Democratic presidential candidate in 2012 and 2016 than those won by Trump, 3 percent compared to 1.3 percent.
Outside of the South, rural Biden counties generally enjoyed faster population growth
Across the entire Midwest, rural counties experienced an average 2.4 percent loss in population from 2010 to 2019. The rural counties that Trump carried in the region performed slightly worse than the average, with a 2.5 percent average decline in population. By contrast, rural counties won by Biden in the Midwest saw 1.8 percent population growth on average, largely due to high rates of population growth in Native American communities that helped Biden win.
In the rural West, counties won by Biden had an average population growth rate more than double the average of all rural counties in the region and four percentage points higher than those won by Trump. Whitman County, in the far eastern side of Washington state, went to Biden by a comfortable margin despite being surrounded by rural counties that went to Trump. Home to an extension of Washington State University, its population grew by 11.9 percent over the last decade, as it enjoyed an influx of newcomers from out-of-state. In the South, the trend for rural counties won by Biden was inverted with a steep average 8.1 percent population loss. This reflects a steady exodus from the region’s deeply distressed predominantly minority counties. And in the Northeast, rural counties won by Biden also lost population but at a lesser rate than those won by Trump.

How These Trends Buoyed Biden in Wisconsin
Wisconsin represents the kind of rural patchwork where inroads are still possible for Democratic candidates despite steep losses in 2016 and meager gains in 2020. Biden carried six rural counties in Wisconsin, tied with South Dakota for the state that gave him the most ground in the rural Midwest. Unlike South Dakota, where the average non-white share of the population in rural counties won by Biden was 74 percent, race appeared less a factor in Wisconsin, where that share was 24.4 percent
Wisconsin provides evidence of how small demographic differences can change election outcomes in rural counties. Biden won back Sauk County, which had flipped to Trump in 2016 after going for Obama the previous two presidential elections, by a margin of around 600 votes. Coincidentally, that is almost the exact same number of new residents that moved to the county between 2014 and 2018 from deep blue neighboring Dane County (Madison), which Biden won by a landslide. Of course, not all those newcomers are necessarily Biden voters, but nonetheless it points to the importance of small margins in the 2020 election cycle.
Native Americans in Wisconsin also voted overwhelmingly for Biden, and were crucial for several of his wins in the state’s rural counties. Biden won 82 percent of the votes in Menominee County, which consists almost entirely of the Menominee Indian Reservation, and also won Bayfield and Ashland Counties, both of which have sizable Native American populations.
Leisure and hospitality shares were much higher in rural counties picked up by Biden in Wisconsin, 18.3 percent, compared to 11.6 percent for those that went to Trump. In Bayfield County, which Biden won comfortably, 26.7 percent of the county’s jobs are in the leisure and hospitality sector, the highest for any rural county in the state.
Conclusion
Even though many rural counties fit the farm belt stereotypes of being overwhelmingly white with very little population churn, the political map of rural America is much more differentiated in reality. Some rural counties are welcoming newcomers with very different voting patterns, who are looking beyond metropolitan areas for their new residency, a trend only likely to accelerate as more white collar Americans are working remotely. Still other rural counties are home to economically struggling communities of color, too often overlooked by policymakers, especially Hispanics and Native Americans in the West and the Midwest and Black Americans in the South. While there is no disputing that much of rural America is synonymous with Trump Country and will cast its votes accordingly (again, he won 90 percent of rural counties), an important minority of rural counties went their own way in the 2020 election and are ones to watch as rural America evolves, both economically and politically.
1 Defined throughout this analysis as counties outside of a metro area
2 2020 election results are still being finalized, so the winner of some counties will likely change in the coming weeks as the remaining ballots are counted.


