


By August Benzow
Half of U.S. metros are on track to recover all the jobs lost during the COVID-19 recession this year
The national unemployment rate has fallen close to where it was before the COVID-19 recession and the country is on track to climb above its 2019 job numbers this year. While there are concerns that inflation will setback what is ostensibly a rapid recovery from a severe economic crisis, the national economy is clearly recovering much quicker than it did from the Great Recession. Beneath the national numbers job growth is more of a patchwork. The underlying geographic inequality of the economic recovery from the COVID-19 recession that defined the map in 2020 has persisted through the end of 2021. Most of the metros that were leading the recovery in 2020 had a robust economy going into the crisis, while the country’s legacy metros, like Detroit and Cleveland, joined ranks with large metros hit hard by the pandemic, like New York City and San Francisco, in their steep job losses and weak bounceback. Recently published data shows that these trends have persisted in 2021 even as job growth has sped up in some metros and slowed down in others. As the national economy inches closer to a full recovery, metros that entered the pandemic on a strong footing are reaping disproportionate rewards while other metros fall further behind.
These disparate recovery trends that have played out across U.S. metro areas create a patchwork map of accelerated economic growth in some parts of the country and persistent, large job gaps in other parts. The map below groups metros by their current employment trajectory. The country’s 383 metro areas roughly break into four groups. The first group, which includes 85 metros or 22 percent of all metros, has already surpassed the employment numbers they had in December 2019. The second group, which includes an additional 122 metros (32 percent), will surpass their 2019 job numbers if they add jobs in 2022 at the same pace as they did in 2021. By contrast, the third group, which includes 96 metros (25 percent), isn’t likely to reach 2019 levels until 2023. Finally, 79 metros (21 percent) fall into the fourth group and may not hit 2019 levels until sometime beyond 2023 on current trendlines. It is impossible to predict future trends with certainty and some metros may speed up their recovery in 2022 and others might slow down for myriad reasons. However, it seems likely that around half of metros will be back above 2019 employment levels by the end of this year.
Metros in the first and second groups mostly enjoyed moderate to high growth in the years prior to the COVID-19 recession. A notable exception is Elkhart, IN, which saw a 4 percent decline in jobs from 2017 to 2019, but was buoyed during the pandemic by 15 percent growth in manufacturing, likely due to its specialization in RV manufacturing.. Inversely, most metros in the third and fourth groups were seeing slow growth or an outright loss of jobs prior to the pandemic with some having been stuck in this trend since the Great Recession and others experiencing a more recent slowdown. San Francisco is the largest metro to contradict this trend. It saw 4.2 percent growth in jobs from 2017 to 2019 but was still nearly 150,00 jobs below its pre-pandemic levels at the end of 2021.
There are lagging metros in every region of the country, but they tend to be the most concentrated in the Midwest and Northeast where around two-thirds of metros fall into these categories. Some notable exceptions include Detroit, which saw its recovery pick up speed in 2021, buoyed by auto manufacturing, and Cincinnati, which was on a more robust trajectory in 2021 than its generally more economically successful northern neighbor, Columbus, OH. Columbus outpaced Cincinnati in 2020, however, so that both metros were about equal distance from their 2019 number by the end of 2021. The uneven pace that many metros recover jobs, and the differing depths of their initial pandemic job losses, makes their future growth hard to predict.
Metros in the West perform much better than any other part of the country with 71 percent of them having already recovered jobs lost during the pandemic or are on track to do so this year. Large areas of the South perform very well, including most of Florida and Texas, while areas like the Mississippi Delta and Louisiana are far behind their pre-pandemic numbers. New Orleans saw its job growth mostly flatline in 2021, a worrying trend for a metro that never recovered all of the jobs lost from Katrina and was hit hard by the Great Recession.
On current trendlines, most metros are seeing a faster recovery than they did in the wake of the Great Recession
Another way to frame the economic recovery of U.S. metros is to look at the share of metros that surpass their prior peak employment levels. After any recession, certain parts of the country usually never recover completely. This was the case with the Great Recession, in the wake of which fully one-quarter of U.S. metro areas never returned to their pre-recession employment levels. So far the climb out of the trough from the COVID-19 recession has been pretty comparable to the recovery from the Great Recession with just 22 percent of metros having returned to 2019 job numbers a few months shy of the two year anniversary of the crisis. However, if the 122 metros that are on track to surpass 2019 job numbers this year achieve that goal, this figure would climb to 54 percent, approximately where the country was at five years after the Great Recession, a significantly faster recovery that would track with the speed of the national recovery.
The Sunbelt has dominated the recovery
Among the 50 largest metros, Austin saw the most robust growth since December 2019, with a 4.1 percent increase in jobs. Salt Lake also performed exceptionally well at 3.1 percent growth above and beyond pre-pandemic levels. A handful of metros hovered just under 2.0 percent, generally showcasing the economic strength of the sunbelt. On the other side of the scale, steep declines from 2019 numbers are still widespread with New Orleans in the deepest hole, down 8.4 percent from 2019. Large metros like New York City and Los Angeles along with entertainment centers like Orlando and legacy metros like Pittsburgh are also still very much in the red.
Disparities that existed between metros before the current crisis have driven the divergence in recovery trajectories. In 2018, Austin’s rapid growth saw it overtake slow-growing Cleveland, OH in terms of total jobs to become the country’s 25th largest employer (Cleveland’s rank 10 years ago). With these tailwinds, Austin saw a much smaller loss of jobs in April 2020 and a rapid V-shaped recovery in the following months. It now has 47,200 more jobs than it did in 2019 with strong gains in professional services and financial activities, both sectors that Cleveland had fewer jobs in compared to 2019. Cleveland’s job growth flatlined in 2020 and has made slow gains in 2021. It now has 53,400 jobs fewer than it did at the end of 2019 with steep losses in leisure and hospitality and education and health. Even more stark, in February 2020 the gap in jobs between Austin and Cleveland was 77,500 jobs and now that gap has more than doubled to 159,700 jobs. It seems unlikely that this gap will shrink significantly in the foreseeable future.
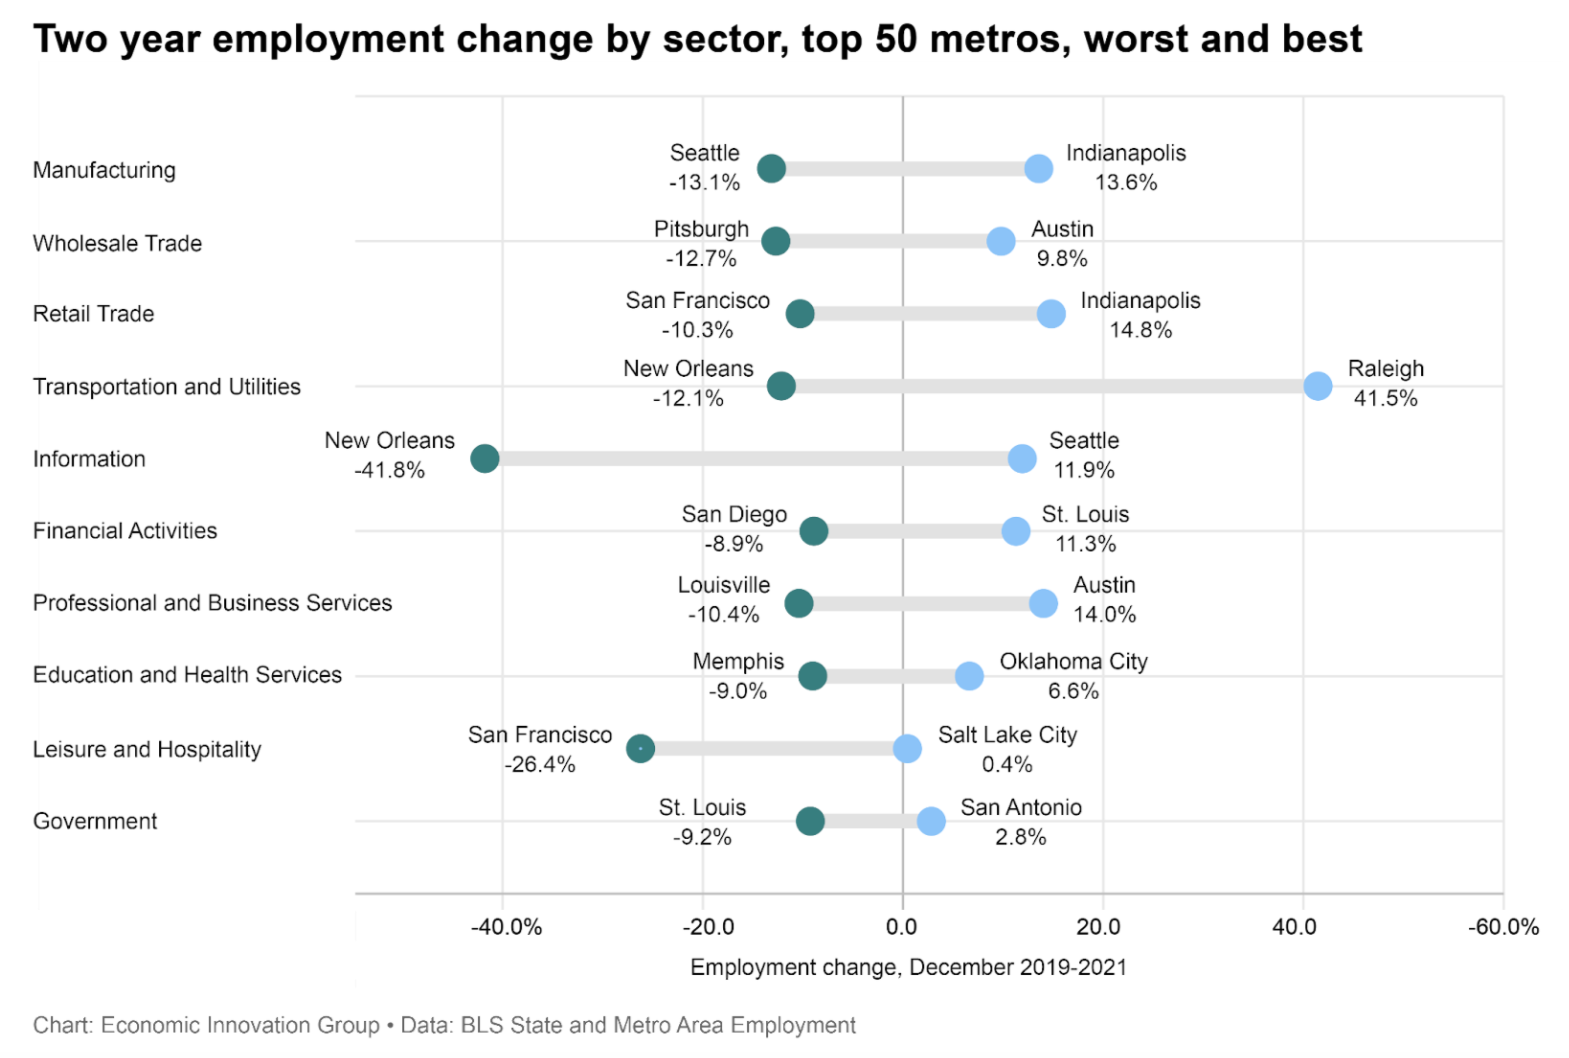
Although leisure and hospitality is still the hardest hit sector, there is substantial variation between metros
Leisure and hospitality continues to be the hardest hit industry sector in most metros. Among the 50 largest metros (based on population), only Salt Lake managed to eke out a small amount of growth in this sector while San Francisco was more than 25 percent below its 2019 leisure and hospitality jobs. The much larger Los Angeles metro had nearly a half million fewer leisure and hospitality jobs than it did in 2019. In the graph below that shows the best and worst change in employment by sector from 2019 to 2021, stark job losses in certain sectors have kept down growth in many large metros. Seattle was down 24,300 manufacturing jobs even as it gained 15,700 information jobs. Steep losses in education and health have held back economic growth as well. Although Memphis had the steepest percentage decrease in this sector, Detroit shed over 100,000 jobs in education and health, with its recovery boosted instead by compensatory gains in manufacturing. This analysis of industry sectors demonstrates how within metros, a reshuffling is happening as some sectors hemorrhage jobs while others boom. Even Austin, an overall net gainer, was still down 24,000 leisure and hospitality jobs and 4,000 education and health jobs from 2019.
As the anniversary of the economic crisis triggered by the COVID-19 pandemic approaches the two-year marker, the country’s diverse metro areas find themselves at dramatically varying stages of recovery. There is increasing evidence that the disparities in employment between metros that existed before the pandemic have been expanded and warped over the past two years. Absent a dramatic acceleration in the speed of the national recovery, it is quite likely that at least half of the country’s metropolitan areas will still not be back to where they were in 2019 by the end of this year.