


The U.S. Census Bureau’s Business Dynamics Statistics (BDS) program released its estimates for the year 2014 this week. BDS provides invaluable insight into the firm-level dynamics of creative destruction in the economy, tracking firm startups and shutdowns, establishment openings and closings, and the employment changes associated with each at the national, state, and metropolitan area levels.
The latest annual data confirm a stagnation in the country’s startup rate coming out of the Great Recession. This stagnation now punctuates a long-term decline in both the share of all firms in the U.S. economy that are less than one year old and in the employment impact of such startups.
Specifically, the new data show:
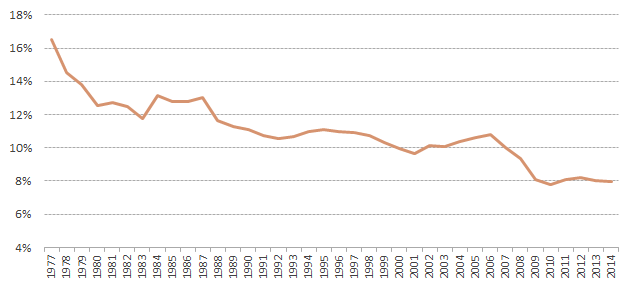
Startups’ share of all U.S. firms fell from 8.1% in 2013 to 8.0% in 2014. 403,900 new firms opened in 2014, down from 404,500 in 2013. The startup rate remains well below the 10.8% achieved in 2006 and only slightly above all-time low of 7.8% reached in the depths of the recession.
Startups as Percent of Total Firms
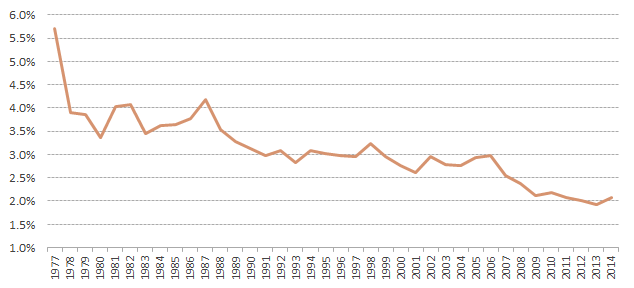
Startups’ share of all U.S. jobs rose slightly from the all-time low of 1.9% reached in 2013 to 2.1% in 2014. That figure remains low, however — equivalent to 2009 and 2011 levels and well below the 3.0% achieved before the latest recession, in 2006.
Share of U.S. Employment in Startups
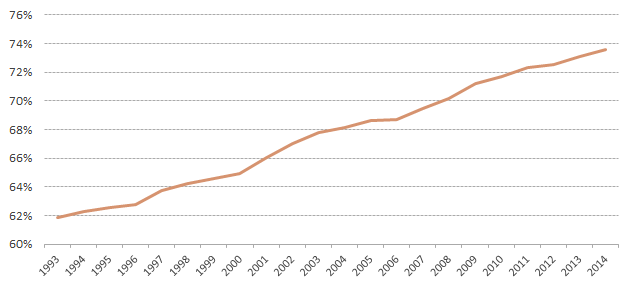
The share of all U.S. jobs in firms age 16 years or older reached another all-time high (for firms of this age data only goes back to 1993) of 73.6 percent, up another half a percentage point over the year.
Share of U.S Employment in Firms Age 16 and Older
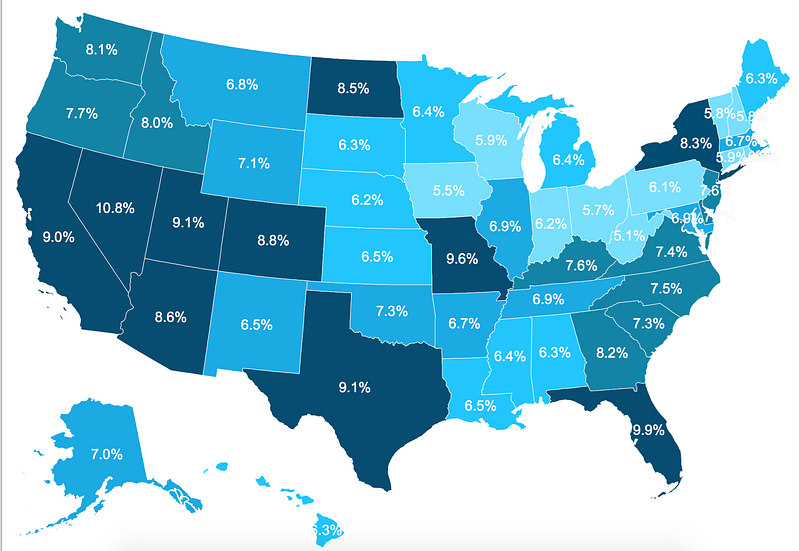
The five states with the highest share of startups out of all firms were Nevada (10.8%), Florida (9.9%), Missouri (9.6%), Utah (9.1%) and Texas (9.1%). The five states with the lowest share of startups out of all firms were West Virginia (5.1%), Iowa (5.5%), Ohio (5.7%), Vermont (5.8%), and New Hampshire (5.8%). In general, startup intensity runs highest in the West and lowest in the Great Lakes and New England. Missouri and Kentucky saw the largest percentage point increases in all firms that were startups, rising by 0.7 percentage points in the former and 0.5 percentage points in the latter.
Startups’ Share of Total Firms by State
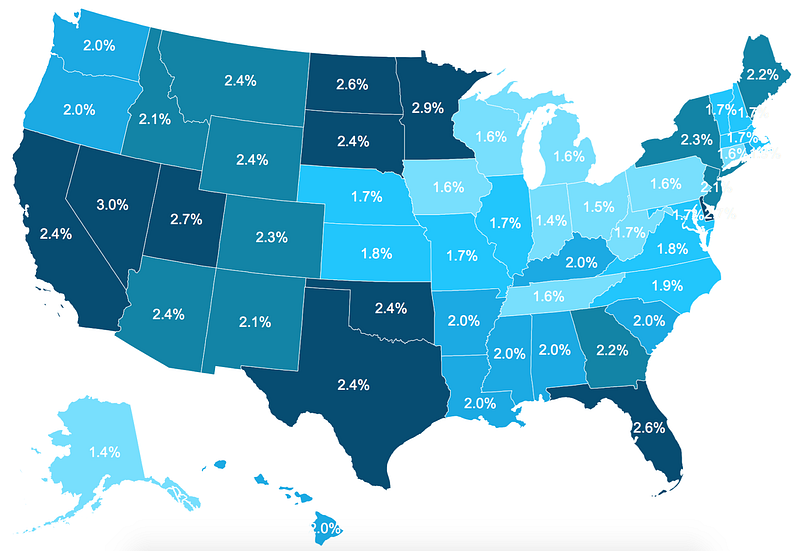
The five states with the highest share of startup employment were Nevada (3.0%), Minnesota (2.9%), Delaware (2.8%), Utah (2.7%), and Florida (2.6%). The five states with the lowest share of startup employment were Alaska (1.4%), Indiana (1.4%), Ohio (1.5%), DC (1.6%), and Connecticut (1.6%). In general, startups employ the largest share of the workforce in parts of the Sun Belt and Upper Midwest and the lowest share in the Great Lakes. Minnesota and Delaware saw the largest percentage point increases in employment in startups over the year, rising by 1.5 percentage points in the former and 0.8 percentage points in the latter.
Startups’ Share of Total State Employment
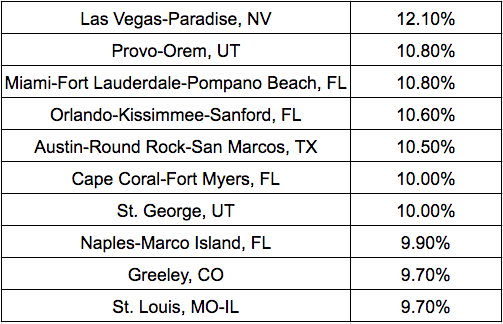
Among metro areas, Las Vegas had the largest share of startups out of total firms (12.1%), followed by the Provo-Orem metro area, UT (10.8%), Miami, FL (10.8%), Orlando, FL (10.6%) and Austin, TX (10.5%).
Startups Share of Total Firms by Metro Area (10 Highest)
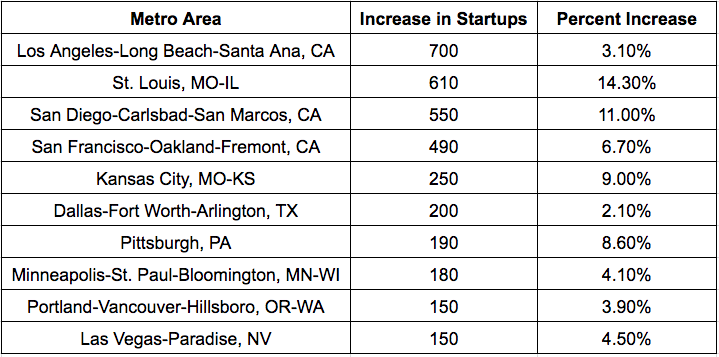
Los Angeles saw the largest absolute increase in number of startups from 2013 to 2014, rising by roughly 700 or 3.1 percent. In absolute terms it was followed closely by St. Louis, where the number of startups increased by 610 for a 14.3% growth rate.
Metro areas with the largest absolute increase in startups from 2013 to 2014
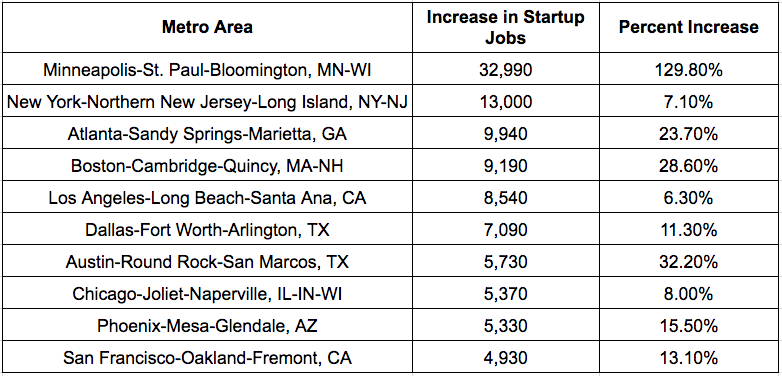
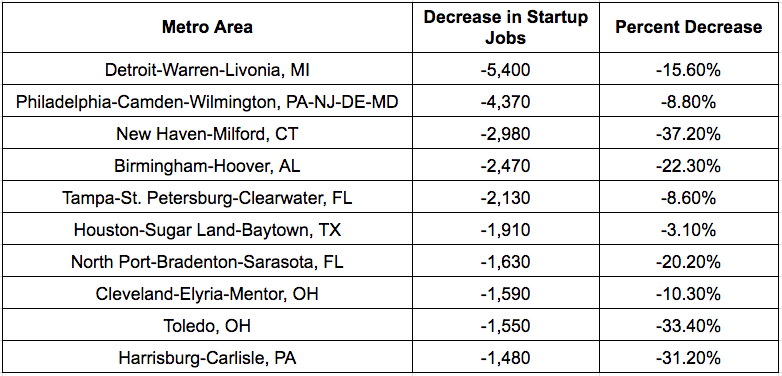
Minneapolis exhibited a substantial increase in the number of new startup jobs (+33,000), a 130% annual growth rate. This was paired with a 4.1 percent increase in the number of startups over the year. Detroit and Philadelphia had the largest over the year decline in the number of startup jobs created during 2014, of 5,400 (8.8 percent) and 4,400 (15.6 percent), respectively.
Metro areas with the largest absolute increase in startups jobs from 2013 to 2014
Metro areas with the largest absolute decrease in startups jobs from 2013 to 2014
All together, these trends show that the United States can and does still produce new firms, but that its startup capacity remains diminished relative to the country’s past and that its startup landscape remains too geographically uneven. In that sense, these latest firm-level data corroborate the establishment-level findings from our own recent report, The New Map of Economic Growth and Recovery. Several years into the recovery from the Great Recession, startup rates and employment have yet to significantly increase, suggesting that the present stagnation near historically low levels represents a disturbing new normal for American entrepreneurship. EIG is tracking these trends closely, as well as their consequences and possible remedies.