
The most dynamic state today scores like one of the least dynamic states from two decades ago
Recently, EIG released our Index of State Dynamism (ISD), a new way of measuring and analyzing the long-term decline in economic dynamism across the United States. The Index allows you to view and compare changes at the state, regional, and national levels going back to 1992.
At a time when there is growing concern that the United States economy is becoming fundamentally less dynamic, our analysis reveals a widespread departure from the entrepreneurial, mobile, and opportunistic traits that defined the most prosperous decades of the U.S. economy.
Economic dynamism refers to the rate and scale of change in the economy brought about by the constant opening and closing of businesses, movement of workers to new areas, and regular turnover of jobs. The ISD provides a new way to measure economic dynamism using a set of interrelated economic metrics going back more than two decades, allowing you to explore the dataset and change over time for each state. The seven metrics of dynamism analyzed in depth in the report are: the startup and firm closure rates, the change in total number of firms, employment in new companies, employment in older incumbents, labor force participation rates, job turnover rates, and domestic migration rates.
Why does this matter? Because dynamic economies tend to be more resilient in the face of disruption. They’re better positioned to innovate and thrive. And they’re likely to be richer in opportunity.
Key findings from the study include:
- The decline of dynamism has been steep, rapid, and pervasive across all states going back to the early 1990s. Every state saw dynamism fade over the period analyzed — and most states saw a sizable drop. The Great Recession accelerated the decline, causing an average state to lose one-third of its dynamism. Fourteen states reached their all-time lows on the index in 2014, five years into an economic recovery.
- Nevada ranks number one as the most dynamic state in the country and West Virginia the least dynamic. Overall, the ISD maps clear regional differences in state-level dynamism. It reveals an unambiguous East-West divide, with the highest concentration of dynamic states found in the West and the least dynamic found east of the Mississippi River, particularly in the Great Lakes region.
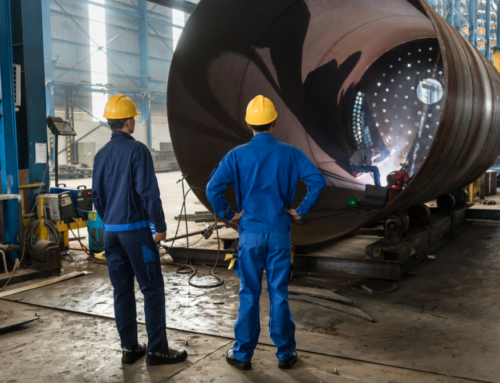
- More dynamic states tend to have higher foreign-born shares of the population and smaller manufacturing sectors. These economies tend to be newer and more prosperous ones — states with younger populations, newer housing stocks, and much higher proportions of foreign-born residents. The least dynamic state economies tend to be the most manufacturing-dependent and have the least developed information services sectors.
- States with top-tier dynamism scores show unmistakable signs of resilience in response to economic trauma, posting much stronger jobs recoveries than their peers following the Great Recession. In fact, the top-performing quintile of states on the index prior to the recession was the only cohort to beat national average employment growth during the recovery. The jobs recovery in the bottom tier of states was only half as strong.